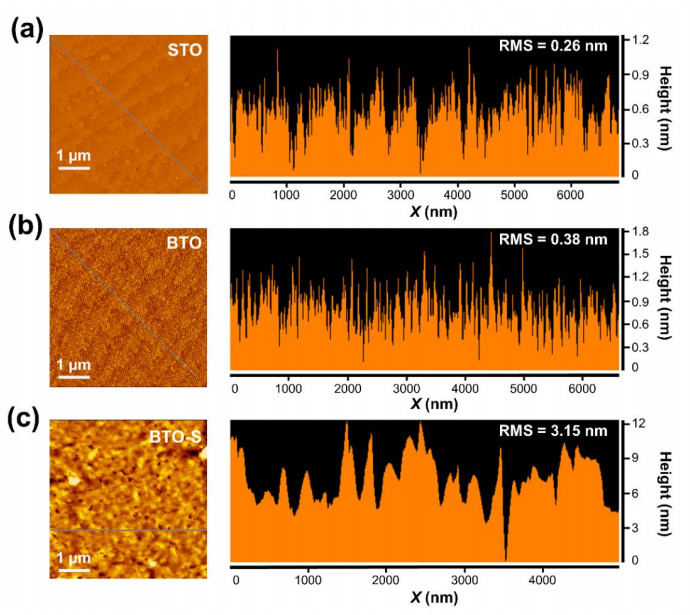
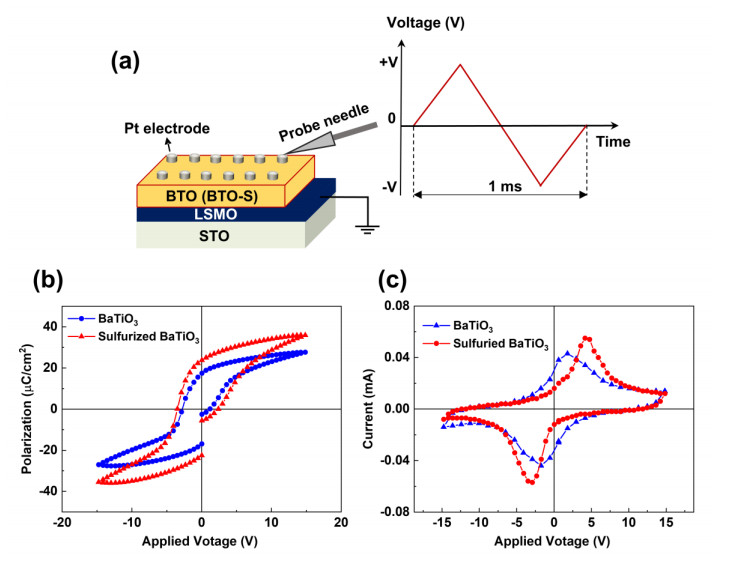
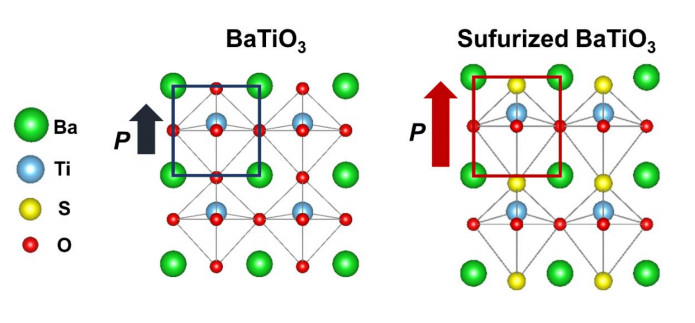
Sulfur is a promising anion dopant for exploring exotic physical phenomena in complex perovskite oxides. However, sulfurization to the epitaxial single-crystal oxide thin films with high crystallinity is experimentally challenging due to the volatility of sulfur element; thus, sulfurization effects on the associated properties have been scarcely studied. Here, we demonstrate an enhancement of ferroelectric polarization of epitaxial BaTiO3 thin films by sulfur doping. Initially, the epitaxial BaTiO3 thin films with high crystallinity were grown by pulsed laser deposition (PLD). Then, sulfurization to epitaxial BaTiO3 films was performed using a precursor of thiourea (CH4N2S) solution via a spin-coating technique. The crystalline structure of sulfurized BaTiO3 films was identified by X-ray diffraction (XRD) and scanning transmission electron microscopy (STEM). The structural distortion with the elongated out-of-plane lattice constant was observed in the sulfurized BaTiO3 films. Atomic force microscopy (AFM) analyses also confirmed the surface morphology of films after sulfurization. Interestingly, we found an enhanced ferroelectric polarization in sulfur-doped BaTiO3 films accompanying the improved tetragonality in the crystal structure after sulfurization. The increments in the remnant (~34.8%) and saturated (~30.6%) polarizations of sulfurized BaTiO3 films were obtained in comparison with pure BaTiO3 films. Our work could be a primary study for a thorough understanding of the sulfur doping effect in perovskite oxides, opening up the potential of oxysulfide materials.
Citation: Xuan Luc Le, Nguyen Dang Phu, Nguyen Xuan Duong. Enhancement of ferroelectricity in perovskite BaTiO3 epitaxial thin films by sulfurization[J]. AIMS Materials Science, 2024, 11(4): 802-814. doi: 10.3934/matersci.2024039
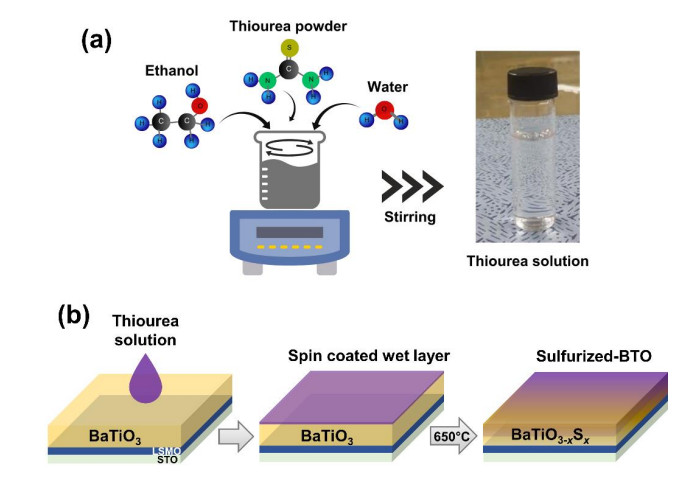
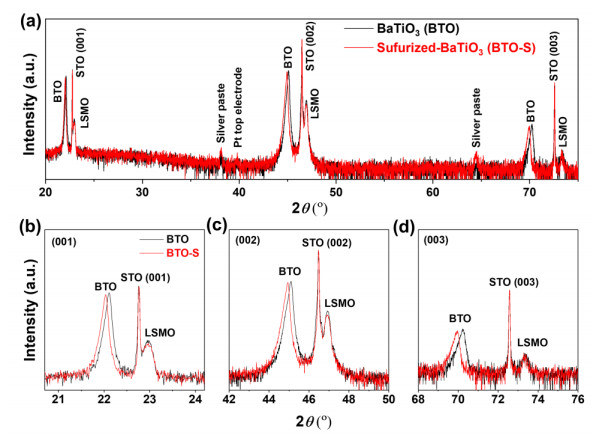
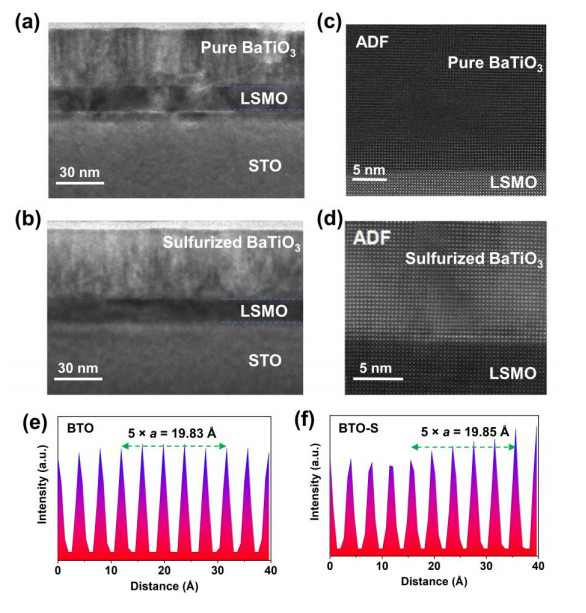
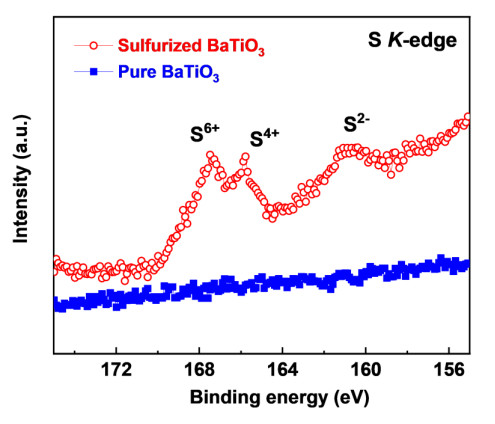
Sulfur is a promising anion dopant for exploring exotic physical phenomena in complex perovskite oxides. However, sulfurization to the epitaxial single-crystal oxide thin films with high crystallinity is experimentally challenging due to the volatility of sulfur element; thus, sulfurization effects on the associated properties have been scarcely studied. Here, we demonstrate an enhancement of ferroelectric polarization of epitaxial BaTiO3 thin films by sulfur doping. Initially, the epitaxial BaTiO3 thin films with high crystallinity were grown by pulsed laser deposition (PLD). Then, sulfurization to epitaxial BaTiO3 films was performed using a precursor of thiourea (CH4N2S) solution via a spin-coating technique. The crystalline structure of sulfurized BaTiO3 films was identified by X-ray diffraction (XRD) and scanning transmission electron microscopy (STEM). The structural distortion with the elongated out-of-plane lattice constant was observed in the sulfurized BaTiO3 films. Atomic force microscopy (AFM) analyses also confirmed the surface morphology of films after sulfurization. Interestingly, we found an enhanced ferroelectric polarization in sulfur-doped BaTiO3 films accompanying the improved tetragonality in the crystal structure after sulfurization. The increments in the remnant (~34.8%) and saturated (~30.6%) polarizations of sulfurized BaTiO3 films were obtained in comparison with pure BaTiO3 films. Our work could be a primary study for a thorough understanding of the sulfur doping effect in perovskite oxides, opening up the potential of oxysulfide materials.

| [1] |
Calle-Vallejo F, Martínez JI, García-Lastra JM, et al. (2010) Trends in stability of perovskite oxides. Angew Chem Int Ed 49: 7699–7701. http://dx.doi.org/10.1002/anie.201002301 doi: 10.1002/anie.201002301

|
| [2] | Ishihara T (2009) Perovskite Oxide for Solid Oxide Fuel Cells, New York: Springer New York. https://doi.org/10.1007/978-0-387-77708-5 |
| [3] |
Li X, Zhao H, Liang J, et al. (2021) A-site perovskite oxides: an emerging functional material for electrocatalysis and photocatalysis. J Mater Chem A 9: 6650–6670. https://doi.org/10.1039/D0TA09756J doi: 10.1039/D0TA09756J
|
| [4] |
Singh S, Singh D (2017) Structural, magnetic and electrical properties of Fe-doped perovskite manganites La0.8Ca0.15Na0.05Mn1− xFexO3 (x = 0, 0.05, 0.10 and 0.15). J Alloys Compd 702: 249–257. https://doi.org/10.1016/j.jallcom.2017.01.154 doi: 10.1016/j.jallcom.2017.01.154
|
| [5] |
Wu Y, Cao G (1999) Enhanced ferroelectric properties and lowered processing temperatures of strontium bismuth niobates with vanadium doping. Appl Phys Lett 75: 2650–2652. https://doi.org/10.1063/1.125107 doi: 10.1063/1.125107
|
| [6] |
Rani A, Kolte J, Gopalan P (2018) Structural, electrical, magnetic and magnetoelectric properties of Co-doped BaTiO3 multiferroic ceramics. Ceram Int 44: 16703–16711. https://doi.org/10.1016/j.ceramint.2018.06.098 doi: 10.1016/j.ceramint.2018.06.098
|
| [7] |
Jana A, Sahoo S, Chowdhury S, et al. (2022) Spectroscopic comprehension of Mott-Hubbard insulator to negative charge transfer metal transition in La NixV1−xO3 thin films. Phys Rev B 106: 205123. https://doi.org/10.1103/PhysRevB.106.205123 doi: 10.1103/PhysRevB.106.205123
|
| [8] |
Brehm JA, Takenaka H, Lee CW, et al. (2014) Density functional theory study of hypothetical PbTiO3-based oxysulfides. Phys Rev B 89: 195202. https://doi.org/10.1103/PhysRevB.89.195202 doi: 10.1103/PhysRevB.89.195202
|
| [9] |
Shannon RD, Prewitt CT (1969) Effective ionic radii in oxides and fluorides. Acta Crystallogr B 25: 925–946. https://doi.org/10.1107/S0567740869003220 doi: 10.1107/S0567740869003220
|
| [10] |
Perera S, Hui H, Zhao C, et al. (2016) Chalcogenide perovskites–an emerging class of ionic semiconductors. Nano Energy 22: 129–135. https://doi.org/10.1016/j.nanoen.2016.02.020 doi: 10.1016/j.nanoen.2016.02.020
|
| [11] |
Li FF, Liu DR, Gao GM, et al. (2015) Improved visible-light photocatalytic activity of NaTaO3 with perovskite-like structure via sulfur anion doping. Appl Catal B-Environ 166: 104–111. https://doi.org/10.1016/j.apcatb.2014.10.049 doi: 10.1016/j.apcatb.2014.10.049
|
| [12] |
Ishikawa A, Yamada Y, Takata T, et al. (2003) Novel synthesis and photocatalytic activity of oxysulfide Sm2Ti2S2O5. Chem Mater 15: 4442–4446. https://doi.org/10.1021/cm034540h doi: 10.1021/cm034540h
|
| [13] |
Ma J, Tang K, Mao H, et al. (2018) Behavior and impact of sulfur incorporation in zinc oxysulfide alloy grown by metal organic chemical vapor deposition. Appl Surf Sci 435: 297–304. https://doi.org/10.1016/j.apsusc.2017.11.092 doi: 10.1016/j.apsusc.2017.11.092
|
| [14] |
Wang Y, Sato N, Fujino T (2001) Synthesis of BaZrS3 by short time reaction at lower temperatures. J Alloys Compd 327: 104–112. https://doi.org/10.1016/S0925-8388(01)01553-5 doi: 10.1016/S0925-8388(01)01553-5
|
| [15] |
Itoh M, Inabe Y (2003) Optical properties and electronic structure of yttrium oxysulfide. Phys Rev B 68: 035107. https://doi.org/10.1103/PhysRevB.68.035107 doi: 10.1103/PhysRevB.68.035107
|
| [16] |
Niu S, Huyan H, Liu Y, et al. (2018) Band-gap control via structural and chemical tuning of transition metal perovskite chalcogenides. Adv Mater 29: 1604733. https://doi.org/10.1002/adma.201604733 doi: 10.1002/adma.201604733
|
| [17] |
Lee SM, Cho YS (2016) Optical and grain boundary potential characteristics of sulfurized BiFeO3 thin films for photovoltaic applications. Dalton Trans 45: 5598–5603. https://doi.org/10.1039/C5DT04585A doi: 10.1039/C5DT04585A
|
| [18] |
Bilgin I, Liu F, Vargas A, et al. (2015) Chemical vapor deposition synthesized atomically thin molybdenum disulfide with optoelectronic-grade crystalline quality. ACS Nano 9: 8822–8832. https://doi.org/10.1021/acsnano.5b02019 doi: 10.1021/acsnano.5b02019
|
| [19] |
Lelieveld R, Ijdo DJW (1980) Sulphides with the GdFeO3 structure. Acta Crystallogr B 36: 2223–2226. https://doi.org/10.1107/S056774088000845X doi: 10.1107/S056774088000845X
|
| [20] |
Tang X, Li D (2008) Sulfur-doped highly ordered TiO2 nanotubular arrays with visible light response. J Phys Chem C 112: 5405–5409. https://doi.org/10.1021/jp710468a doi: 10.1021/jp710468a
|
| [21] |
Gonbeau D, Guimon C, Pfister-Guillouzo G, et al. (1991) XPS study of thin films of titanium oxysulfides. Surf Sci 254: 81–89. https://doi.org/10.1016/0039-6028(91)90640-E doi: 10.1016/0039-6028(91)90640-E
|
| [22] |
Sayago DI, Serrano P, Böhme O, et al. (2001) Adsorption and desorption of SO2 on the TiO2 (110)-(1×1) surface: A photoemission study. Phys Rev B 64: 205402. https://doi.org/10.1103/PhysRevB.64.205402 doi: 10.1103/PhysRevB.64.205402
|
| [23] |
Liu Y, Lou X, Bibes M, et al. (2013) Effect of a built-in electric field in asymmetric ferroelectric tunnel junctions. Phys Rev B 88: 024106. https://doi.org/10.1103/PhysRevB.88.024106 doi: 10.1103/PhysRevB.88.024106
|
| [24] |
Tagantsev AK, Gerra G (2006) Interface-induced phenomena in polarization response of ferroelectric thin films. J Appl Phys 100: 051607. https://doi.org/10.1063/1.2337009 doi: 10.1063/1.2337009
|
| [25] |
Jesse S, Rodriguez BJ, Choudhury S, et al. (2008) Direct imaging of the spatial and energy distribution of nucleation centres in ferroelectric materials. Nat Mater 7: 209–215. https://doi.org/10.1038/nmat2114 doi: 10.1038/nmat2114
|
| [26] |
Chisholm MF, Luo W, Oxley MP, et al. (2010) Atomic-scale compensation phenomena at polar interfaces. Phys Rev Lett 105: 197602. https://doi.org/10.1103/PhysRevLett.105.197602 doi: 10.1103/PhysRevLett.105.197602
|
| [27] |
Cohen RE (1992) Origin of ferroelectricity in perovskite oxides. Nature 358: 136–138. https://doi.org/10.1038/358136a0 doi: 10.1038/358136a0
|
| [28] |
Megaw HD (1952) Origin of ferroelectricity in barium titanate and other perovskite-type crystals. Acta Crystallogr A 5: 739–749. https://doi.org/10.1107/S0365110X52002069 doi: 10.1107/S0365110X52002069
|
Figures(7)

Xuan Luc Le, Nguyen Dang Phu, Nguyen Xuan Duong. Enhancement of ferroelectricity in perovskite BaTiO3 epitaxial thin films by sulfurization[J]. AIMS Materials Science, 2024, 11(4): 802-814. doi: 10.3934/matersci.2024039


 DownLoad: