


Figure 1.
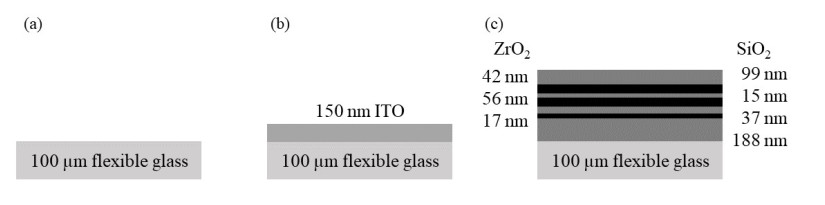
Sample groups investigated in this paper: (a) uncoated 100 µm UTG, (b) UTG with a 150 nm ITO coating, and (c) UTG with an antireflective layer stack consisting of seven layers with a total thickness of 455 nm.
Ultra-thin flexible glass with thicknesses of 100 µm or below is a substrate in the fields of optics, electronics, and semiconductors. Its brittleness is challenging in production processes like physical vapor deposition processes, especially in roll-to-roll production. In many cases, multiple geometric deformations take place and each step, like coating or cutting, influences the glass strength. By now, the relation between the strength of ultra-thin glass under quasi-static conditions and its strength under cyclic load has not been studied. Moreover, the effect of coatings has not been investigated. Both aspects are crucial to design reliable production processes. Therefore, the strength of ultra-thin glass under cyclic load was studied for uncoated and coated substrates. Two coating types were investigated: a single indium tin oxide film and a seven-layer antireflective layer stack. The coatings significantly influence the strength of the underlying glass in both test modes. The barrier properties, thin film stress, and the morphology/crystalline structure are identified as the major characteristics influencing the strength.
Citation: Wiebke Langgemach, Andreas Baumann, Manuela Ehrhardt, Thomas Preußner, Edda Rädlein. The strength of uncoated and coated ultra-thin flexible glass under cyclic load[J]. AIMS Materials Science, 2024, 11(2): 343-368. doi: 10.3934/matersci.2024019
| [1] | Johana Gamez, Luis Reyes-Osorio, Oscar Zapata, Roberto Cabriales, Luis Lopez, Miguel Delgado-Pamanes . Study of protective hard coatings of SiO2-TiO2 on aluminum substrates. AIMS Materials Science, 2024, 11(2): 200-215. doi: 10.3934/matersci.2024011 |
| [2] | Muhamed Shajudheen V P, Saravana Kumar S, Senthil Kumar V, Uma Maheswari A, Sivakumar M, Sreedevi R Mohan . Enhancement of anticorrosion properties of stainless steel 304L using nanostructured ZnO thin films. AIMS Materials Science, 2018, 5(5): 932-944. doi: 10.3934/matersci.2018.5.932 |
| [3] | Haridas D. Dhaygude, Surendra K. Shinde, Ninad B. Velhal, G.M. Lohar, Vijay J. Fulari . Synthesis and characterization of ZnO thin film by low cost modified SILAR technique. AIMS Materials Science, 2016, 3(2): 349-356. doi: 10.3934/matersci.2016.2.349 |
| [4] | Eduard Kessler, Rainer Gadow, Jona Straub . Basalt, glass and carbon fibers and their fiber reinforced polymer composites under thermal and mechanical load. AIMS Materials Science, 2016, 3(4): 1561-1576. doi: 10.3934/matersci.2016.4.1561 |
| [5] | Claas Hüter, Shuo Fu, Martin Finsterbusch, Egbert Figgemeier, Luke Wells, Robert Spatschek . Electrode–electrolyte interface stability in solid state electrolyte systems: influence of coating thickness under varying residual stresses. AIMS Materials Science, 2017, 4(4): 867-877. doi: 10.3934/matersci.2017.4.867 |
| [6] | Timur Zinchenko, Ekaterina Pecherskaya, Dmitriy Artamonov . The properties study of transparent conductive oxides (TCO) of tin dioxide (ATO) doped by antimony obtained by spray pyrolysis. AIMS Materials Science, 2019, 6(2): 276-287. doi: 10.3934/matersci.2019.2.276 |
| [7] | Mohammed Y. Abdellah, Hamzah Alharthi, Mohamed K. Hassan, Ahmed F. Mohamed . Effect of specimen size on natural vibration of open hole copper/glass-reinforced epoxy laminate composites. AIMS Materials Science, 2020, 7(4): 499-517. doi: 10.3934/matersci.2020.4.499 |
| [8] | Nur Jassriatul Aida binti Jamaludin, Shanmugan Subramani, Mutharasu Devarajan . Thermal and optical performance of chemical vapor deposited zinc oxide thin film as thermal interface material for high power LED. AIMS Materials Science, 2018, 5(3): 402-413. doi: 10.3934/matersci.2018.3.402 |
| [9] | Dominik Flore, Konrad Wegener . Influence of fibre volume fraction and temperature on fatigue life of glass fibre reinforced plastics. AIMS Materials Science, 2016, 3(3): 770-795. doi: 10.3934/matersci.2016.3.770 |
| [10] | Nikolay A. Voronin . Analysis of the mechanisms of deformation of topocomposites by modeling of the indentation load-displacement curves. AIMS Materials Science, 2019, 6(3): 397-405. doi: 10.3934/matersci.2019.3.397 |
Ultra-thin flexible glass with thicknesses of 100 µm or below is a substrate in the fields of optics, electronics, and semiconductors. Its brittleness is challenging in production processes like physical vapor deposition processes, especially in roll-to-roll production. In many cases, multiple geometric deformations take place and each step, like coating or cutting, influences the glass strength. By now, the relation between the strength of ultra-thin glass under quasi-static conditions and its strength under cyclic load has not been studied. Moreover, the effect of coatings has not been investigated. Both aspects are crucial to design reliable production processes. Therefore, the strength of ultra-thin glass under cyclic load was studied for uncoated and coated substrates. Two coating types were investigated: a single indium tin oxide film and a seven-layer antireflective layer stack. The coatings significantly influence the strength of the underlying glass in both test modes. The barrier properties, thin film stress, and the morphology/crystalline structure are identified as the major characteristics influencing the strength.
Glass belongs to the oldest materials of mankind. Nevertheless, innovative glass compositions and/or manufacturing methods enable new application areas until today. While being most visible in architecture, automotive, and optics, glass is also gaining importance in electronics and semiconductor industry where it is used for packaging, in wafer-level optics and in displays. Ultra-thin glass (UTG) with a thickness below 100 µm was also implemented into first foldable smartphones.
The superior material characteristics of UTG compared to polymer films might be the reason for its use in foldable displays. Its barrier properties are often used as a benchmark. Moreover, it is highly transparent in the visible and near infrared spectrum and the surface roughness is low. In addition, it is dimensionally stable in a wide temperature range and shows a high surface hardness [1]. However, the benefits of all these positive material properties are limited by the brittleness of the glass.
The brittleness of UTG is possibly the main obstacle hindering its widespread use in bendable or flexible applications. The glass strength is statistically distributed following the Weibull distribution [2,3]. Moreover, it is no material property but a product characteristic, which is strongly influenced by the glass forming process, handling, cutting, coating, and other types of post-processing. Nonetheless, very thin glass products can benefit from an active size effect, i.e., the smaller volume or surface area compared to thick glass products leads to a lower failure probability since the number of defects is smaller [4]. This enables high strength products like foldable flexible glass displays. In the case of thick glass like architectural glass or container glass, the glass strength is a property of minor importance as long as it fulfills the product requirements [5]. In contrast, the glass strength is highly relevant for UTG processing.
The whole UTG functionalization, like coating or cutting, strongly influences the glass strength. UTG can be produced and post-processed in sheet-to-sheet processes as well as roll-to-roll processes. In both cases, the change of glass strength during the functionalization process must be considered [6]. Nevertheless, only a small body of literature dealt with ultra-thin glass strength, especially concerning coated glass [6,7,8].
The strength of UTG is strongly influenced by coatings. Coatings of high industrial relevance are for example transparent conductive electrodes like indium tin oxide (ITO) and antireflective layer stacks (AR). Transparent conductive electrodes are used in nearly all kinds of displays with ITO clearly dominating the market today [9]. It has already been shown that the annealing of ITO thin films lowers the strength of ITO-coated UTG considerably [6]. In the display industry, AR stacks are often used to improve the user experience or provide additional properties like easy-to-clean surfaces or scratch protection [10,11]. Apart from that, AR coatings are also relevant in optics. Ultra-thin glass is an excellent substrate for sputter coatings and thus also suitable for the deposition of ITO and AR stacks.
UTG shows a higher geometric deformability than any flat glass product before. Moreover, not only intentional but also unintentional deformations might happen during the production process and use. The determination of fatigue properties under cyclic loading conditions is standardized for many materials. For example, DIN 50100:2022-12 [12] prescribes a load-controlled setup for fatigue testing of metallic specimens, and DIN 53442:1990-09 [13] defines a test method for flat plastics specimens. ISO 13003:2003 [14] describes the test conditions for fiber-reinforced plastics. By now, no standards are available for glass testing.
Despite the lack of standardized test procedures, several attempts have been made to analyze the reliability and fatigue behavior of thick glass in the past. The strength of thick glass and also of ceramics under dynamic or cyclic loading conditions has been found to be strongly dependent on the environmental conditions, the loading and the cycle number [15,16]. Tests have been performed under static conditions as well as under cyclic conditions, e.g. described in [17,18,19,20,21,22] provides a comprehensive list and comparison of the literature concerning fatigue investigations of soda-lime glass. Other glass compositions have been evaluated in the past as well but not as detailed.
In general, it has been shown that cyclic fatigue of glass differs from cyclic fatigue of metals [18]. Previous research has moreover established that the strength under cyclic loading conditions can be estimated using the theory of subcritical crack growth, i.e. that defects grow slowly until a certain threshold value. Then, critical crack growth occurs leading to total failure [3,21,23,24]. It can be assumed that this mechanism is also valid for UTG. Nevertheless, the influence of coatings on this behavior has not yet been considered in literature. Moreover, the test equipment used for thick glass is not suitable for UTG testing due to the increased flexibility of UTG.
Strength tests for flexible glass have to be miniaturized because of the low thickness and the large deformability of the glass. Because of that, low forces are applied in most cases. Even though no standardized method is available for strength testing of UTG, several techniques have been adapted to the needs of UTG in the past, e.g., 2-, 3- or 4-point tests, ball-on-ring tests and tensile tests [6,25,26,27,28,29,30]. All setups are quasi-static and most lack the possibility of performing reliability tests under cyclic load or tests have been limited to pre-damaged specimens in the past. A procedure for rapid fatigue testing was recently proposed in [31]. The setup allows quasi-static strength testing and strength tests under cyclic load in the same setup. Moreover, the method is suitable for tests of specimens without pre-damages. It was used for the investigations presented in this paper and is explained in detail in section 2.2.
This paper aims to explore the influence of cyclic loading on the strength of uncoated and sputter coated UTG. The first part provides an overview of the selected combinations of UTG substrates and thin films. Then, the test procedure and data processing are described. In the final section, we examine the strength of uncoated and coated UTG under quasi-static conditions and under cyclic loading with a special focus on the influence of coatings. In addition, it assesses the importance of edge quality.
We intended to provide an overview of the effect of cyclic loading on the strength of ultra-thin glass with a thickness of 100 µm. Therefore, selected example systems from three different groups of samples with high industrial relevance were investigated: uncoated glass, glass with a single ITO coating, and glass with an antireflective layer stack (Figure 1).
In all tests, UTG with a thickness of 100 µm was investigated. Four types of uncoated UTG were analyzed: Schott AF32, Schott D263T, NEG G-Leaf, and Corning Willow Glass [32,33,34,35]. The sheet size of the UTG was 30 × 35 cm2 in all cases. The sheets were cut into smaller specimens for strength investigation measuring 20 × 120 mm2 by scribing and breaking using a Solid-D diamant cutting blade by MDI Advanced Processing GmbH. The scribe pressure was between 0.04 and 0.08 MPa. The best pressure for each glass type was decided by the system operator. The scribe speed was 50 mm/s and the scribe table was covered with a 50 µm polyethylene terephthalate (PET) layer. The specimens were separated by hand. The time between cutting and strength measurement was in the range between one month and four months since all specimens were cut in one batch, but the strength tests had to be carried out successively over three months. Coated glass was cut after coating.
Two variations of sputtered ITO thin films were chosen for the investigations: an as deposited film and an annealed film. The as deposited ITO coating was sputtered with additional hydrogen flow. The presence of hydrogen during ITO sputter deposition leads to a higher charge carrier density which results in a lower resistivity [36]. This is often required in (industrial) applications. The annealed ITO thin film shows a low resistivity as well. The coating parameters and the major properties of the two variations of ITO coatings are listed in Table 1. Both ITO variations were deposited on Schott D263T and Schott AF32. An inline vertical pilot scale vacuum coater for substrate sizes up to 120 × 60 cm2 was used for thin film deposition. Thin film thickness was determined using the profilometer XP-200 by Ambios and resistivity was measured using the four-point method. Residual thin film stress after deposition was determined from the curvature of special stress measurement glass stripes (5 × 60 × 0.15 mm3) using the Stoney method [37]. A P15-LS profilometer by Tencor was used for the curvature measurement of the measurement stripes before and after thin film deposition. The atomic force microscope Explorer by Topometrix was used to investigate the surface roughness. After coating, specimens for strength tests of a size of 20 × 120 mm2 were cut as described above.
| ITO as deposited | Annealed ITO | ||
| Sputtering | Working pressure | 0.3 Pa | 0.3 Pa |
| Sputter power | 4 kW/m, DC mode | 4 kW/m, DC mode | |
| O2/(O2 + Ar+ H2) | 4.1% | 1.75% | |
| H2/(O2 + Ar + H2) | 3.3% | - | |
| Deposition rate | 29 nm·m/min | 28 nm·m/min | |
| Annealing | Atmosphere | - | Air |
| Temperature | - | 300 ℃ | |
| Relative humidity | - | 40% ± 5% at 20 ℃ | |
| Duration | - | 15 min | |
| Characteristics | Film thickness | 150 nm ± 10 nm | 150 nm ± 10 nm |
| Resistivity | 345 µΩcm | 255 µΩcm | |
| Thin film stress | −700 MPa | −1100 MPa | |
| Crystallinity | Amorphous | Crystalline | |
| Surface roughness Ra | 0.8 nm | 1.5 nm |
 DownLoad:
CSV
DownLoad:
CSV
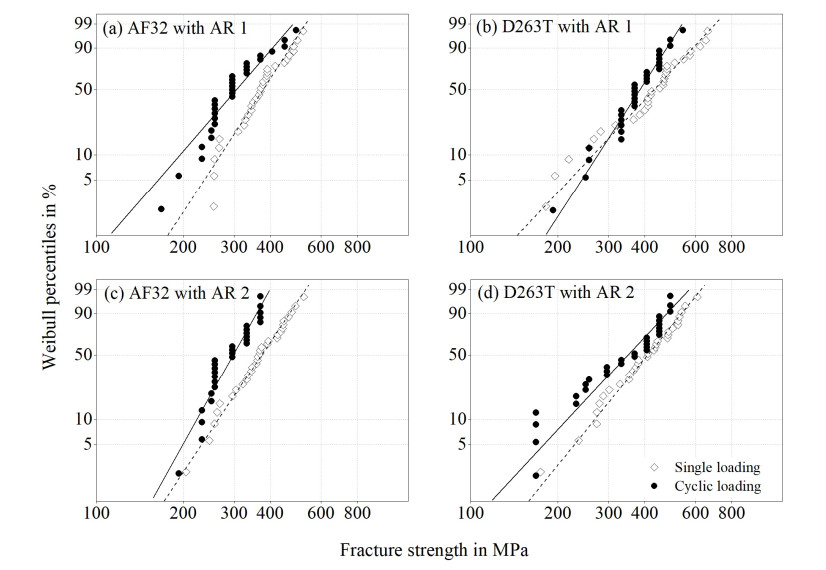
The AR-system consisted of seven layers with a total thickness of 455 nm. Zirconium dioxide was used as the highly refractive material while silicon dioxide was chosen as the low refractive one. The thickness of the single layers is displayed in Figure 1. Two variations of the system were analyzed. They differ in the crystalline structure of the zirconium dioxide and the resulting thin film stress (Table 2). Also, the AR coatings were deposited on Schott D263T and Schott AF32. Ceramic rotatable targets were used to deposit the ZrO2 layers. The power density was 12.5 kW/m. The SiO2 layers were deposited using pure silicon planar targets with a power density of 13.3 kW/m. An impedance control loop allowed the reactive gas control of oxygen. The sheets were cut after deposition.
| AR 1: SiO2-ZrO2 | AR 2: SiO2-ZrO2: Si | |
| Crystallinity | Monoclinic/tetragonal | X-ray amorphous |
| Crystallinity SiO2 | X-ray amorphous | X-ray amorphous |
| Thin film stress (ZrO2) | −347 MPa | −132 MPa |
| Thin film stress (stack) | −218 MPa | −263 MPa |
DownLoad:
CSV
Tests within this paper were performed using the YUASA U-Shape Folding Test Machine by Bayflex solutions [38] as shown in Figure 2. The setup is commercially available and can perform reliability tests with a reasonable speed of up to 30 bending cycles per minute. This allows fatigue tests with large deformations in an economically viable time frame. Moreover, the system is easy to handle. Specimens are installed horizontally, and the setup allows the simultaneous deformation of up to ten specimens. Despite its simplicity in handling, the U-shape test suffers from a highly non-linear deformation of the specimens which results in a non-constant strain rate. However, the deformation process and the resulting stress states of the specimens are described in detail in [31]. Thus, the stress distribution and history at any point of the specimen is non-linear but predictable. Moreover, the effective length of the specimens is high for low stress values compared to a conventional 2-point bending test. This is beneficial to analyze early failure, which is crucial to investigate the influence of processing on the strength of flexible glass. As proposed in [31], an adapted 3D printed specimen holder was used to hold the specimens form-fitted instead of force-fitted by clamping. The latter would lead to immediate breakage at the clamping edge.
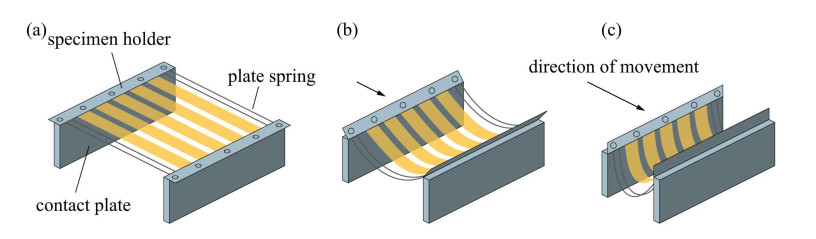
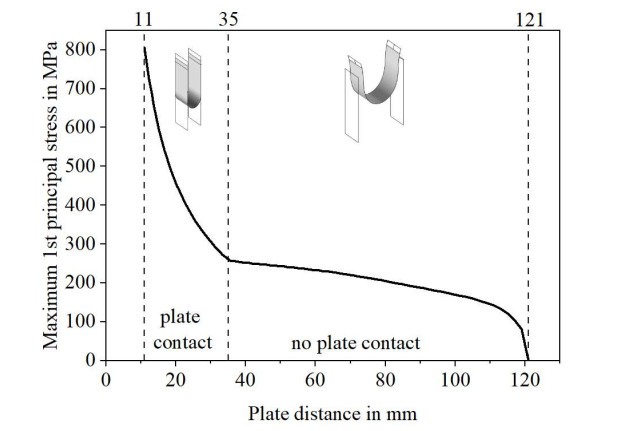
Specimen deformation in this setup comprises two phases. The process starts from the horizontal position (Figure 2a). First, the specimen holders are tilted into a vertical position while being simultaneously brought together (Figure 2b). The specimen consequently forms an arc and later a drop. When the specimen holders reach the vertical position, the specimen nestles onto a contact surface and forms a U (Figure 2c). Afterwards, the plate distance is further reduced leading to a compression of the U-shape. The minimum plate distance is 11 mm. The stress history at all positions for all time increments can be derived from a finite elements method (FEM) simulation as presented in [31]. The minimum plate distance corresponds to a maximum stress of approximately 800 MPa. Maximum stress occurs on the convex surface in the middle of the specimen. Figure 3 shows the resulting maximum stress curve dependent on the plate distance. The setup can be used to evaluate the relation between UTG strength and its strength under cyclic load, especially since no stiffness degradation needs to be accounted for. This knowledge can help to decrease the risk of material failure during UTG processing due to intended and unintended substrate deformation.
The test machine can be used for both quasi-static strength testing and strength testing under cyclic load. In the first case, specimens are deformed from the horizontal state until failure, while stepwise testing is used for the latter investigation mode. Within this paper, all specimens were tested with the cut/coated side under tensile stress. A 45 µm polypropylene adhesive tape with a width of 15 mm was attached to the other side of the specimens (width: 20 mm) to reduce the damage risk by glass splinters. Moreover, the adhesive tape allowed the analysis of fracture patterns after failure. The origin of fracture was determined from the fracture patterns for all specimens by visual inspection. The adhesive tape has a strength-reducing influence which will not be further addressed in this paper. All tests were carried out at a temperature of 22 ℃ and 40% ± 5% relative humidity. The strength tests were performed with a deformation speed of 1 mm/s from the horizontal specimen position until failure. Two specimens were tested simultaneously. The plate distance at fracture was determined acoustically from video recordings of the tests since no load cell is available in the setup.
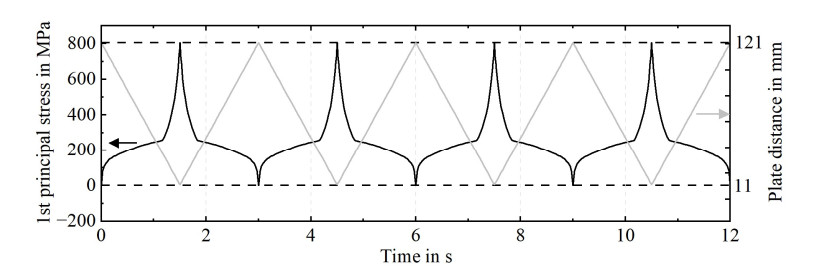
The procedure was adapted to evaluate the influence of cyclic loading on the glass strength as proposed in [31]. In the tests, ten specimens were tested simultaneously. The test parameters are listed in Table 3. Load was increased stepwise, i.e., the minimum plate distance was decreased stepwise. For each load step, the specimens were deformed 500 times. Broken specimens were removed. The specimens were deformed with a frequency of 25 min−1 (0.42 Hz) for plate distances over 42 mm, and 20 min−1 (0.33 Hz) for plate distances below. Based on the simulation results presented in [31], the load steps were chosen in a way that the difference between two steps was between 25 and 75 MPa. The test routine was interrupted when only three or fewer specimens remained. These were set aside, and the test routine was continued together with other surviving specimens later. Due to the complex shaped bending line during a deformation cycle (Figure 2), a highly non-linear loading signal results locally as shown by the line average of the 1st principal stress in the middle of the specimen (Figure 4). Nevertheless, it can be estimated as nearly triangular in the range between 250 and 805 MPa or in general, when the plates are in contact with the UTG.
| Load signal | Load type | R | Mean stress | Frequency | Specimen orientation |
| Highly non-linear | Pulsating (tensile) | 0 | 84 MPa … 402 MPa |
0.33 Hz … 0.42 Hz |
Cut/coated side under tensile stress |
DownLoad:
CSV
The Weibull distribution is a continuous statistical distribution and was first described by Waloddi Weibull in 1939 [2]. The two-parametric Weibull distribution for a general strength distribution can be defined as shown in Eq 1:
| F(σ)=1−e−(σσcrit)m | (1) |
F is the failure probability, which can be calculated using two parameters: the critical strength σcrit and the Weibull modulus m. While the critical strength represents the 63.2%-percentile of the distribution, the Weibull modulus describes the form of the distribution. In general, the two-parametric Weibull distribution is used to model the strength of glass [39]. However, Jotz has recently shown that the three-parametric Weibull distribution can be considered when the strength of uncoated UTG is analyzed [8]. In this case, a threshold parameter σ0 is introduced, leading to the three-parametric Weibull distribution as shown in Eq 2:
| F(σ)=1−e−(σ−σ0σcrit−σ0)m | (2) |
To evaluate the strength data properly, the censored nature of the datasets must be considered, i.e., that the exact strength of some specimens is unknown. In the case of this study, the strength of surviving specimens is above 805 MPa according to the FEM simulation in [31] but the exact value is unknown. Thus, the samples were treated as right-censored data. Specimens that did not break during the whole test procedure were considered as survivors in the statistical evaluation. The samples of the strength tests under cyclic load were additionally treated as interval censored data. This is because the test procedure was stepwise and not continuous. Thus, the real strength under cyclic load lies somewhere in the given interval between the two load steps before failure and at failure. Nevertheless, the real value is unknown.
Statistical tests using the Software Minitab were used for the comparison of the strength and the strength under cyclic load for each of the samples. Since the comparison of the whole datasets is not applicable, the difference between the critical strength of both datasets was compared for each sample. To do so, the 95% confidence intervals of the critical strength of the datasets were determined and then compared. By comparing these intervals and not only the critical strength values, the probability of error is 5%.
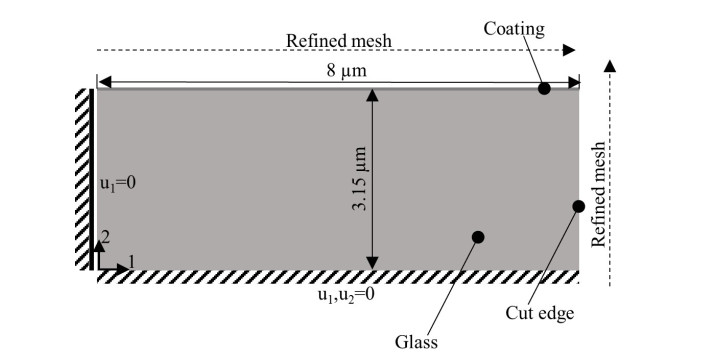
A finite element model (FE model) of a plane glass with a thin coating was used to study the effect of thin film stress on the stress state near the boundary layer and near the cutting edge. Even though the coating is relatively thin with respect to the total thickness of the UTG, additional insights are expected due to the high influence of stress peaks on the fatigue performance known from other materials [40,41,42]. These peaks could be relevant since the thin film stress within the coating is relatively high with respect to the failure stress of the UTG as shown in Tables 1 and 2. In order to model the coated UTG, it is necessary to use a sub model of the UTG itself, due to drastic difference in size of approximately a factor of 1000 in thickness. Furthermore, the FE model focused on ITO coating, due the availability of elastic constants and the homogenous layer compared to an antireflective layer stack. It was decided to model a slice under plane stress condition (since stresses along the edge are of no interest) with a thickness of 3.15 µm including 0.15 µm coating. The model expands 8 µm from the edge of the specimen. Because the edge is of major interest, the mesh is refined in this direction and a minimal size of 10−3 µm is reached in this region. The model is meshed with CPS4R four-node plane stress elements. The residual stress within the coating is applied by a homogenous predefined field in the commercial software Abaqus, which is loaded with −700 MPa. In the calculation step, the model is then brought into equilibrium. Both constituents are assumed linear elastic with an elastic modulus of 116 and 74.8 GPa for ITO coating and glass (Schott AF32) respectively. The Poisson's ratio is taken to 0.35 for ITO and 0.24 for the glass [32,43].
With regard to the boundary conditions, the left-hand edge was assumed to be undeformed in one direction (see Figure 5). For the bottom, edge u2 was taken to be fixed to get the stress state in UTG when stretched to a plane state. For u1 it was finally decided based on mean stress considerations to be set to u1 = 0. The mean stresses within the glass can be calculated according to Eq 3 based on the thickness t ratios.
| σGlass=tCoatingtGlassσCoating | (3) |
With this, it can be shown that for the real UTG thickness of 100 µm a mean tensile stress of 1.1 MPa is present, which is negligible. If u1 would be unconstrained, this would correspond to an actual glass thickness of 3 µm and 35 MPa. Therefore u1 = 0 is the better approximation for the sub-model.
The strength distributions under quasi-static conditions and the distributions of strength under cyclic loading conditions are shown in Figure 6 for the uncoated glass. In this and other diagrams within this paper, the term "single loading" refers to quasi-static strength testing (always marked with diamond shape data points) while "cyclic loading" describes strength tests under cyclic load (circle data points).
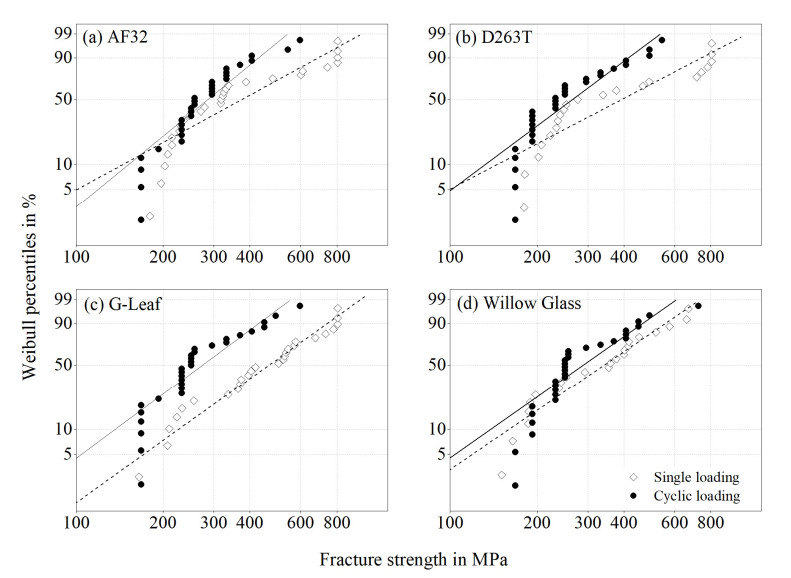
In the case of uncoated glass, the strength could be modeled using three-parametric Weibull distributions like proposed by Jotz in [8]. As seen in Table 4, the threshold values lie in the range between 139 and 173 MPa. In a different test setup with a higher effective length of the specimens and another cutting method, Jotz derived a threshold value of 102 MPa. Considering the differences of the setups, the higher value in the U-shape test seem reasonable. This threshold value could be a minimum strength value but the significance is not yet clear among scientists.
| Glass type | N (Ncensored) | Weibull modulus | σcrit in MPa | σ0 in MPa |
| AF32 | 30 (3) | 0.9 (0.7; 1.2) | 286 (187; 436) | 173 |
| D263T | 29 (8) | 0.8 (0.5; 1.1) | 490 (279; 858) | 173 |
| G-Leaf | 26 (6) | 1.3 (0.8; 2.2) | 430 (311; 593) | 112 |
| Willow glass | 22 (9) | 0.9 (0.6; 1.3) | 454 (287; 718) | 139 |
DownLoad:
CSV
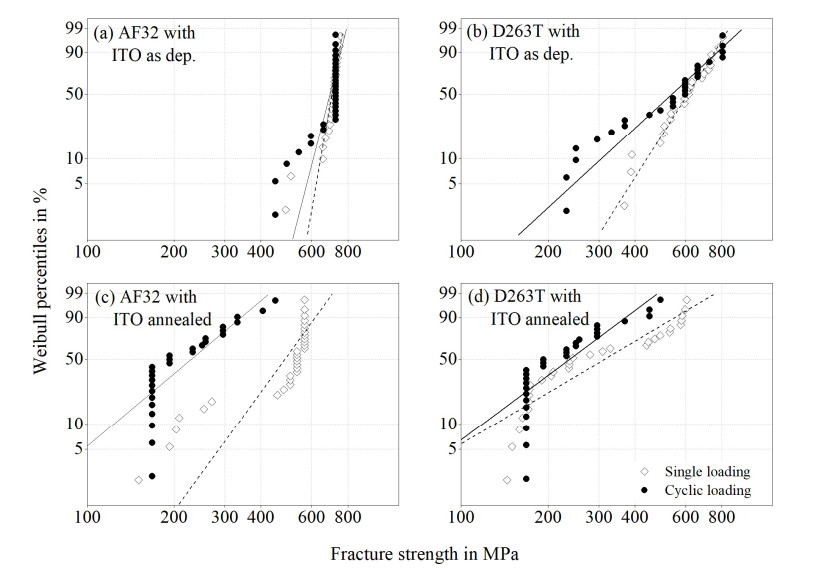
In contrast to the strength under quasi-static conditions, the three-parametric Weibull distribution was not suitable to model the strength of the uncoated glass under cyclic loading conditions (Figure 6). Moreover, the three-parametric Weibull distribution did not fit for any dataset of coated glass (Figures 7 and 8). There, the threshold value derived for the three-parametric distributions was physically senseless in all cases. Moreover, in some cases, the data of ITO coated glass do not follow a single two-parametric distribution either. In contrast, often two or even three different Weibull distributions would be necessary to fit the data. This might be caused by different fracture mechanisms. The superimposition of two or more different distributions might cause the unusual form of the data in the Weibull plot. Nevertheless, two-parametric Weibull distributions were used to describe the datasets of coated glass as displayed in Tables 5 and 6. As seen in Figures 7 and 8, the calculated distributions fit the data well in most cases for the 62.3% percentile of the critical strength. For reasons of comparability, also the strength of the uncoated glass was additionally described using two-parametric Weibull distributions.
| Sample | N (Ncensored) | Weibull modulus | σcrit in MPa |
| AF32 | 27 (3) | 1.8 (1.3; 2.4) | 516 (415; 640) |
| D263T | 21 (8) | 1.6 (1.1; 2.3) | 693 (529; 908) |
| G-Leaf | 26 (6) | 2.3 (1.7; 3.2) | 610 (515; 723) |
| Willow glass | 22 (9) | 1.6 (1.1; 2.2) | 616 (471; 805) |
| AF32 with ITO as dep. | 26 (4) | 11.8 (8.6; 16.1) | 742 (718; 767) |
| D263T with ITO as dep. | 23 (7) | 4.4 (3.1; 6.3) | 733 (669; 804) |
| AF32 with ITO annealed | 30 (0) | 5.0 (3.5; 7.0) | 520 (483; 560) |
| D263T with ITO annealed | 30 (0) | 2.1 (1.6; 2.8) | 371 (311; 443) |
| AF32 with AR 1 | 30 (0) | 5.6 (4.2; 7.3) | 403 (377; 431) |
| D263T with AR 1 | 30 (0) | 3.9 (2.9; 5.2) | 473 (429; 521) |
| AF32 with V2 | 30 (0) | 5.4 (4.1; 7.2) | 399 (373; 428) |
| D263T with V2 | 30 (0) | 4.5 (3.4; 5.9) | 444 (408; 483) |
DownLoad:
CSV
| Sample | N (Ncensored) | Weibull modulus | σcrit in MPa |
| AF32 | 30 (0) | 2.7 (2.1; 3.6) | 301 (262; 346) |
| D263T | 30 (0) | 2.4 (1.8; 3.2) | 279 (238; 328) |
| G-Leaf | 29 (0) | 2.3 (1.7; 3.2) | 286 (242; 339) |
| Willow glass | 30 (0) | 2.5 (1.9; 3.2) | 313 (268; 366) |
| AF32 with ITO as dep. | 30 (0) | 13.2 (9.4; 18.4) | 678 (658; 699) |
| D263T with ITO as dep. | 27 (1) | 3.2 (2.3; 4.3) | 585 (516; 662) |
| AF32 with ITO annealed | 27 (0) | 2.1 (1.4; 3.1) | 220 (180; 270) |
| D263T with ITO annealed | 29 (0) | 1.9 (1.3; 2.8) | 231 (187; 285) |
| AF32 with AR 1 | 29 (0) | 4.2 (3.2; 5.5) | 315 (287; 346) |
| D263T with AR 1 | 30 (0) | 5.7 (4.3; 7.6) | 390 (365; 417) |
| AF32 with V2 | 28 (0) | 6.8 (5; 9.1) | 299 (281; 317) |
| D263T with V2 | 30 (0) | 3.5 (2.5; 4.8) | 362 (325; 403) |
DownLoad:
CSV
As Figures 6–8 show, the distributions of strength and strength under cyclic loading generally differ from each other. Nevertheless, the distributions sometimes show the same tendencies. This is especially obvious in the case of as deposited ITO on AF32, where both distributions show an equal but very unusual behavior. Many specimens of this sample broke suddenly at a very high stress of over 600 MPa in both the strength test and the cyclic load test. Possibly, the compressive thin film stress of approximately −700 MPa influences the strength leading to higher strength values. Since D263T with the same coating does not show this behavior, it is however more likely that the glass type AF32 is responsible for this fracture behavior. Unfortunately, the reason could not be identified within the scope of this paper. Beside this exception, the Weibull modules of the other datasets are very low in most cases (1.6 ≤ m ≤ 6.8), i.e., the data are widely scattered. The high strength of both samples with as deposited ITO coatings is surprising because former tests in the ball-on-ring setup showed an opposite effect on the surface strength of ITO coated UTG [6].
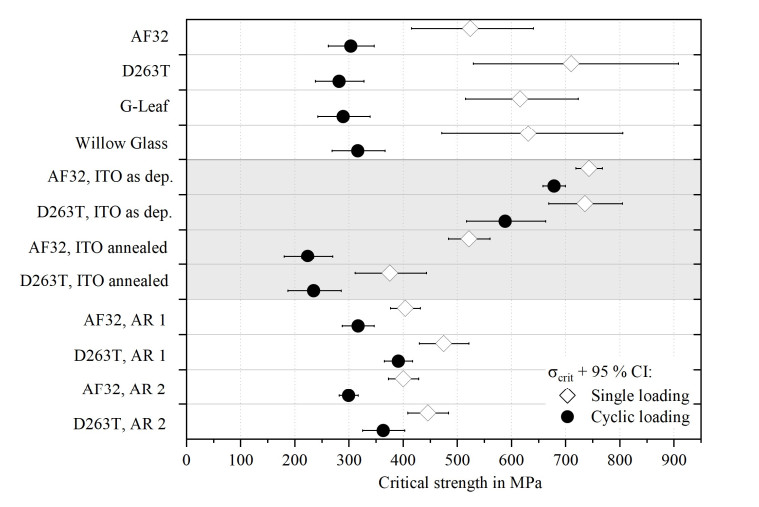
As already mentioned, the distributions of the fracture strength and the strength under cyclic load differ for all tested samples. Moreover, the distributions of the strength under cyclic load are shifted to lower stresses compared to quasi-static conditions. Especially at low failure probabilities, the strength under cyclic load is usually lower. These differences are difficult to quantify due to the stepwise testing procedure of the strength under cyclic load. Nevertheless, differences get obvious when comparing the critical strength values of the corresponding datasets. As shown in Figure 9, the 95% confidence intervals of both values do not overlap in any case (see also Tables 5 and 6). Thus, both characteristic strength values differ significantly in all cases.
For both uncoated and coated glass, low-speed crack growth is the most likely reason for the lower strength under cyclic load. This is usually referred to as "subcritical crack growth" and describes the phenomena that atomic bonds at the crack tip of an existing crack break and the crack grows without leading to immediate failure [15]. In the case of glass, this is strongly supported by water corrosion [3,23]. To differentiate the crack growth under cyclic loading conditions from subcritical crack growth under static loading conditions, the term "cyclic crack growth" is used in this paper. This term was already introduced by Danzer et al. in [39].
Due to cyclic crack growth during cyclic testing, smaller defects become potentially critical. Since cyclic crack growth leads to crack propagation, even small defects can grow to a critical size during the repeated deformation. In other words: when two identical sets of specimens with identical defects were tested in both a quasi-static strength test and a test under cyclic loading conditions, the latter test would most likely lead to lower strength values because the defects can grow more easily during the deformation process compared to the defects under quasi-static conditions. The influence of cyclic crack growth on the strength has already been shown similarly for thick glass [20,21]. Thus, UTG seems to behave comparable to thick glass concerning crack growth under cyclic loading conditions even though the degree of deformation differs considerably.
It is common sense that the largest flaws in glass plates are usually at the edges. Thus, edge failure is assumed to be most likely. Despite that, a reasonable number of specimens showed fracture origins somewhere else in the surface area in this study. The fracture origin is estimated to be on the frontside of the specimens, i.e., on the convex side that has experienced tensile stress during the U-shape test.
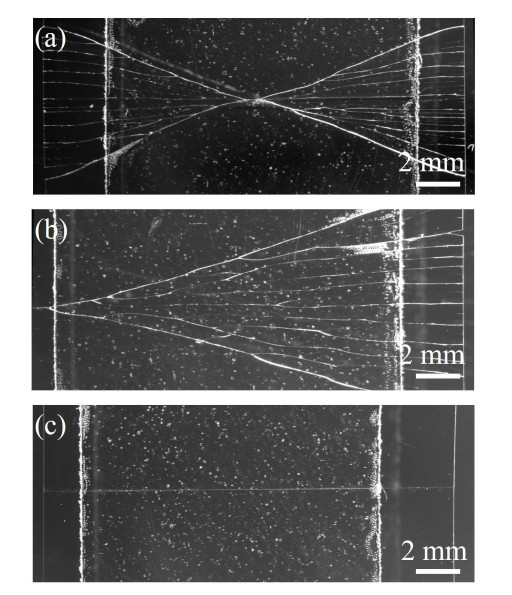
A variety of fracture patterns appeared during the tests. Figure 10 shows examples of the most important types. The patterns were used to identify the origin of fracture. In the case of butterfly-shaped fracture patterns (Figure 10a), the origin of fracture was in the middle of the sample. It was not possible to identify whether the fracture originated from a volume or a surface damage, but due to bending stress, distribution surface failure is more likely. When the pattern was fan-shaped (Figure 10b), the origin of fracture lied at the edge of the specimen. Some specimens broke with a single fracture line (Figure 10c). In these cases, edge failure was assumed likewise.
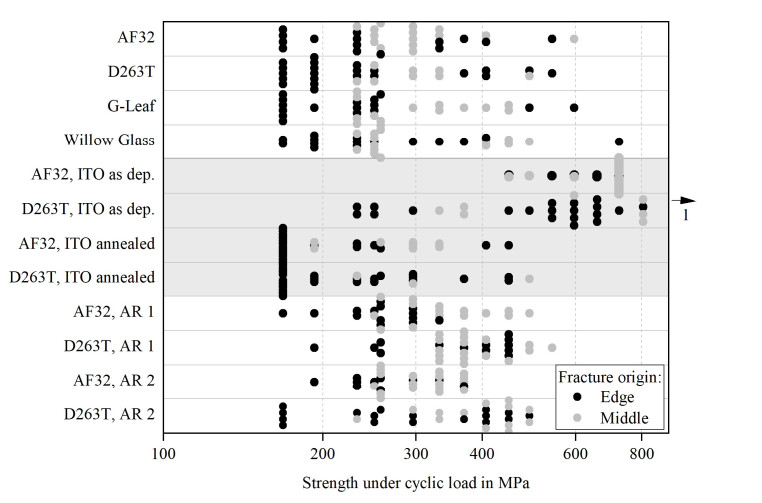
In the case of cyclic loading, edge failure clearly dominates at low failure probabilities while failure in the middle of the specimens gains importance at higher stress and higher failure probabilities (Figure 11). While edge defects can be correlated to the cutting process or handling, the failure in the middle of the surface is probably related to glass handling, the coating procedure and/or the thin film coating itself. From metals, it is established that high strength and less ductile materials are prone to crack initiation already at smaller notches and defects compared to more ductile materials. The main reason for this behavior is that a brittle material cannot mitigate the stress concentration at a crack tip by plasticity [42]. This finding could be applied to the fatigue behavior of glass—also a brittle material. Since edge defects cannot be completely avoided in scribe and break processing, it is most likely that stress concentrates at the tip of an existing edge flaw leading to microcrack growth first and to total failure eventually. This mechanism comprising both crack nucleation and crack propagation is proposed by Masuda et al. in [16]. The growth of edge flaws is also more likely because of stress exaggerations at the specimen edges in the test setup and caused by thin film stress (see also 3.3). In addition to the increased probability of edge flaws, the edges of the coated glass remained uncoated since the glass was cut after coating. Thus, humidity can reach edge flaws unhindered leading to cyclic crack growth also in the case of coated glass.
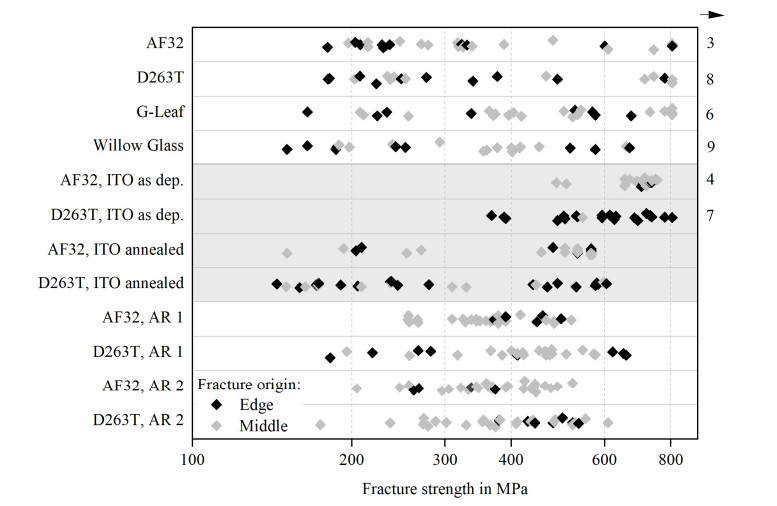
In contrast to cyclic loading, middle defects seem to be more dominant in quasi-static strength tests (Figure 12). Edge defects occur both at low and high stress, but no clear tendency is visible. This is remarkable because the (hardware) test setup remained unchanged for both single and cyclic loading. Moreover, the cyclic loading tests were performed with a higher loading speed which normally leads to higher strength values [7]. A possible explanation is that small edge flaws are present in the samples. While they (nearly) do not grow during quasi-static strength tests, cyclic crack growth is likely during tests under cyclic loading conditions. In the latter case, the former small edge defects grow and can eventually lead to early edge failure while in the first case, the edge defects remain small and other bigger defects, e.g., in the middle of the specimen but also at the edges, lead to later failure. This explanation fits with the assumption of cyclic crack growth as discussed in literature [18,20,21].
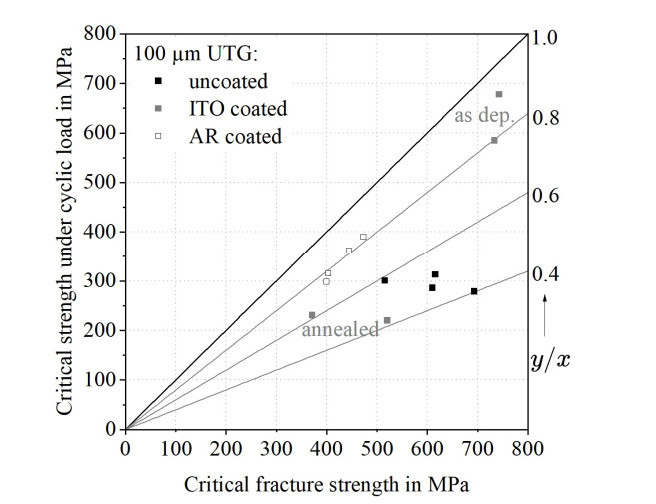
Even though the coating thickness is small compared to the glass thickness, coating properties have a considerable influence on the mechanical behavior of the system. Coatings especially seem to influence the growth of cracks during cyclic loading. Figure 13 shows the correlation between the critical strength under quasi-static conditions and the critical strength under cyclic loading conditions. The critical strength under cyclic load lies in the range of 40% to 90% of the quasi-static strength. The ratio is especially low for uncoated glass and glass with annealed ITO (40%–60%), while it is higher for as deposited ITO and AR coated glass (70%–90%). In the case of coated glass, the coating does not cover the glass edges since the glass was cut after coating. Thus, edge flaws are not (fully) protected. Nevertheless, coatings influence the fracture behavior.
The large difference between the critical fracture strength and the critical strength under cyclic load for uncoated UTG could be attributed to the fact that during cyclic loading, humidity can reach the crack tips better and longer than in single strength tests. Moreover, a tensile mean stress is present during the whole test.
As presented in the review paper [22], most of the previous research focused on the fatigue behavior of specifically and intentionally pre-damaged samples to analyze the strength of thick glass under cyclic load. In this paper, however, no pre-damage was applied to the UTG but damages caused by cutting, handling and coating are present. These could be considered as pre-damages as well but of a more random nature. Nevertheless, the current study is one of the few studies using "undamaged" glass substrates.
Since the uncoated glass samples have an equal edge quality and a comparable surface roughness because of their production process, no significant differences between the four different glass compositions could be detected. Nevertheless, differences between the uncoated and coated samples can be demonstrated. A decrease of strength under quasi static conditions by coatings can be assumed (Figure 13) except for the already mentioned amorphous ITO thin films. In contrast, the critical strengths of uncoated and coated UTG under cyclic loading conditions lie in a smaller range and differences cannot be clearly distinguished on the given data base. However, the coatings probably act in a comparable way to pre-damages since they also often lead to narrower probability distributions of the glass strength. This effect is probably partly compensated by hindering moisture access to crack tips in the underlying UTG.
As already discussed, the access of humidity to crack tips is crucial for cyclic crack growth [23]. In the case of uncoated glass, water can reach the crack tips unhindered. Thus, the corrosive effect of humidity is high for uncoated UTG in the given setup. By implication, any coating on a flaw should hinder the accessibility of the crack tip by humidity and thus reduce the influence of humidity during cyclic loading on the glass strength. This effect is visible for the AR coated samples as well as for the ITO coated samples in the as deposited state, i.e., for amorphous thin films on the glass surface. In these cases, the ratio of the critical fracture strength under cyclic load to the critical strength is increased compared to uncoated glass. However, an opposite effect is demonstrated in the case of UTG with annealed ITO, i.e. a crystalline thin film.
The strength decrease by crystallization was already shown under quasi-static conditions in [6]. The crystallinity of annealed ITO seems to be relevant to explain the strength decrease compared to amorphous ITO also in the case of cyclic loading. Thus, the strength under quasi-static and cyclic loading conditions seems to depend on additional thin film properties than the barrier properties. The influence of thin film morphology, thin film stress and other properties of crystalline ITO on the strength of coated UTG is subject of current research and thus out of the scope of this paper. The influence of thin film morphology, thin film stress, and other properties of crystalline ITO on the strength of coated UTG is subject of current research and thus out of the scope of this paper. However, the Influence of thin film stress will be discussed based on an FE-model in the following section.
Also, in the case of amorphous layers, the influence of thin film stress on the UTG strength could not be finally resolved based on the experimental data. For example, [21] has shown that compressive stress in the surface region of thermally toughened soda-lime glass decreases cyclic crack growth. The surface region of this glass is under compressive stress and compensates crack growth caused by tensile stress approximately until the level of compressive stress introduced is reached. The thin films deposited in this paper all show compressive film stress, too. However, only in the case of AF32 with amorphous (as deposited) ITO, such a compensation effect could be assumed.
As already mentioned, thin films are additional layers on top of the glass surface. Even though they are thin compared to the substrate glass (Figure 14), their inherent thin compressive film stress might significantly influence the glass. The thickness ratio of coating and substrate is 0.0015 for the ITO coatings and 0.0045 for the antireflective layer stacks. Thus, the coating makes up less than 0.5% of the total thickness. Nevertheless, the compressive stress in the thin film leads to a zone of tensile stress in the surface region of the underlying glass. Since the tensile strength of glass is low compared to its compressive strength, this zone could be an explanation for a strength decrease caused by thin film coatings. This decrease is evident for the AR coated samples and also for UTG with as deposited ITO in literature [6]. As already mentioned in section 3.1, the high strength of the coated UTG with ITO as deposited in the U-shape setup is surprising. It remains unclear if this effect can be contributed to the thin film properties, e.g., the amorphous structure caused by the hydrogen atmosphere during sputter deposition. This is subject of future research.
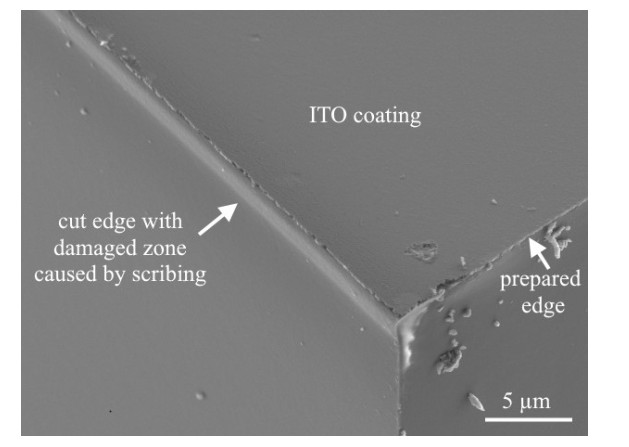
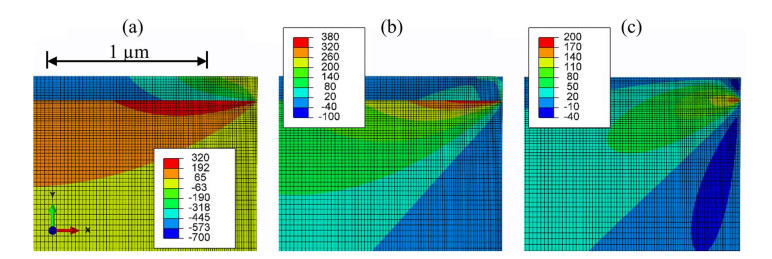
Figure 15 shows the resulting stress distribution for an as deposited ITO thin film with −700 MPa thin film stress on an AF32 UTG. The thin-film stress decreases near the edge but reaches the prescribed −700 MPa within approximately two micrometers from the edge (Figure 15a). The unloaded coating necessitates an equivalent stress increase within the UTG. The stress peak reaches values of up to 360 MPa in terms of maximum principal stress (Figure 15b). This high stress decreases rapidly within one micrometer from the edge. With respect to the observed type of failure, this stress peak cannot be identified as a main cause of failure in static loading. This is because there is no clear indication of preferred failure near the edges for coated AF32. In fatigue loading, the edges become more relevant for early failures. Two possible causes might explain this observation. First, the stress peak within the glass might intensify the influence of defects in this region. Second, second damage in the form of local separation of thin film and UTG could take place [44]. In terms of the shear stress τ12 (Figure 15c) a peak near the boundary layer is visible. The detrimental role that shear stresses at free edges play is well known for multidirectional reinforced fiber reinforced laminates. In this case, differences in Poisson's ratio are the main cause of shear stresses. From the plane stress sub-model in the two-dimensional space, it is hard to estimate if the shear stresses introduced by the thin-film stresses get more severe under bending load (test condition). To better estimate the effect the stress state has on crack initiation, it would be necessary to include a viable failure criterion and study the constituent's properties in more detail.
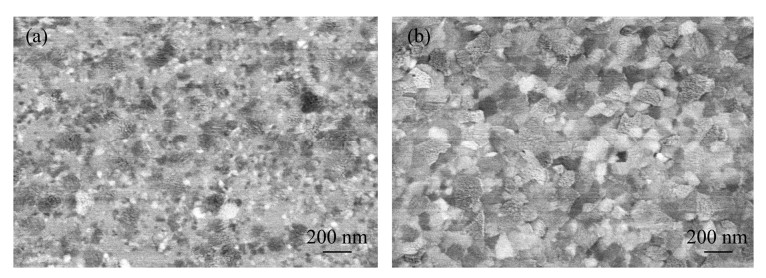
In the case of UTG with annealed ITO, the general strength range is lower than for all other samples (Figure 13). This cannot be explained only considering the accessibility of flaws or crack tips by humidity. Moreover, the barrier properties of ITO are not the only characteristic that changes during annealing. In contrast, several other characteristics are changing, when the crystalline structure is altered during the annealing procedure, e.g., thin film stress increases (Table 1), surface roughness increases (Table 1) and other mechanical properties like the hardness change [6]. Moreover, the nature of the boundary between thin film and substrate might change. Crystallization could for example lead to micro damages in the glass surface which lower the glass strength and the strength under cyclic load. Moreover, each crystal boundary is a possible flaw origin. As shown in Figure 16, the ITO is partly crystallized after deposition (a) and fully crystallized after annealing (b). Thus, crack initiation and propagation might be more likely after annealing. However, only two different ITO variations have been studied so far. The detailed investigation of the reasons for strength differences between UTG with different ITO coatings is out of the scope of this paper but part of future work.
Strength evaluations of 100 µm ultra-thin glass in the uncoated and coated state have proven that cyclic loading leads to a significant strength decrease compared to quasi-static conditions because of cyclic crack growth. This is consistent with findings on thick glass. Investigations into the failure origins have revealed that edge failure clearly dominates at low failure probabilities under cyclic loading conditions. In contrast, no clear dominance was observable under quasi-static conditions. This could be attributed to preferential cyclic crack growth of edge flaws during cyclic loading.
Amorphous thin films (ITO and antireflective layer stacks) seem to reduce cyclic crack growth, i.e., the ratio between strength under cyclic loading conditions and the strength under quasi-static conditions is higher for coated than for uncoated ultra-thin glass. This could be attributed to the barrier properties of the thin films. That is, however, not valid for crystallized ITO. In all cases, compressive thin film stress causes a zone of tensile stress in the underlying glass. This could partly compensate the barrier effect of the thin films but cannot explain the significant strength decrease caused by crystallization. Thus, beside the barrier properties the thin morphology seem to be crucial concerning the strength of coated glass. In contrast, the accessibility of crack tips by moisture is assumed to be the main factor influencing the strength of uncoated glass. The correlation between relevant thin film characteristics (barrier properties, thin film morphology and thin film stress) and the strength of the UTG is subject of future research.
The presented investigations form the basis for strength optimization of coated ultra-thin glass considering both the optimization of the cutting process and the optimization of the coating procedure and the coating characteristics.
The authors declare that they have not used Artificial Intelligence (AI) tools in the creation of this article.
The work presented in this article was partly funded by the AiF-IGF–Industrial Collective Research program based on a decision by the German Bundestag under the grant number 21708 BR (Project Acronym: CUSTOM). This project was supported by the European Society of Thin Films. The authors kindly acknowledge Bayflex solutions, SCHOTT AG, GfE Fremat GmbH and MDI Advanced Processing GmbH for providing the test machine, glass substrates, sputtering targets and glass cutting services. Moreover, the authors thank their colleagues from Fraunhofer IMWS for the SEM picture of a cut coated glass (Figure 14).
The authors declare no conflict of interest.
| [1] | Garner SM, Li X, Huang MH (2017) Introduction to flexible glass substrates, In: Garner SM, Flexible Glass: Enabling Thin, Lightweight, and Flexible Electronics, Hoboken: John Wiley & Sons, 3–33. https://doi.org/10.1002/9781118946404 |
| [2] |
Weibull W (1951) A statistical distribution function of wide applicability. J Appl Mech 18: 293–297. https://doi.org/10.1115/1.4010337 doi: 10.1115/1.4010337

|
| [3] |
Ritter JE (1995) Predicting lifetimes of materials and material structures. Dent Mater 11: 142–146. https://doi.org/10.1016/0109-5641(95)80050-6 doi: 10.1016/0109-5641(95)80050-6
|
| [4] |
Griffith AA (1921) The phenomena of rupture and flow in solids. Philos T Roy Soc A 221: 163–198. https://doi.org/10.1098/rsta.1921.0006 doi: 10.1098/rsta.1921.0006
|
| [5] | Varner J (2003) Festigkeit und Bruchmechanik von Glas, In: Weißmann S, Varner J, Nattermann K, et al. Festigkeit von Glas—Grundlagen und Messverfahren, 2 Eds., Offenbach: Hüttentechnische Vereinigung der Deutschen Glasindustrie. |
| [6] | Lorenz G, Naumann F, Westphalen J, et al. (2016) Correlation of PVD deposition parameters with electrical and mechanical properties of coated thin-glass compounds. 6th Electronic System-Integration Technology Conference (13–15 September), Grenoble, IEEE, 1–6. https://doi.org/10.1109/ESTC.2016.7764740 |
| [7] | Glaesemann GS (2017) The mechanical reliability of thin, flexible glass, In: Garner SM, Flexible Glass: Enabling Thin, Lightweight, and Flexible Electronics, Hoboken: John Wiley & Sons, 35–62. https://doi.org/10.1002/9781118946404 |
| [8] | Jotz M (2022) Kantenfestigkeitsoptimierte (Weiter-) Entwicklung eines Verfahrens zum Trennen von ultradünnem Glas, Ilmenau: Universitätsverlag Ilmenau. https://doi.org/10.22032/dbt.53125 |
| [9] | Vineet K (2022) Transparent conductive films market. Available from: https://www.alliedmarketresearch.com/transparent-conductive-films-market. |
| [10] |
Glöß D, Frach P, Gottfried C, et al. (2008) Multifunctional high-reflective and antireflective layer systems with easy-to-clean properties. Thin Solid Films 516: 4487–4489. https://doi.org/10.1016/j.tsf.2007.05.097 doi: 10.1016/j.tsf.2007.05.097
|
| [11] |
Khan S, Wu H, Huai X, et al. (2018) Mechanically robust antireflective coatings. Nano Res 11: 1699–1713. https://doi.org/10.1007/s12274-017-1787-9 doi: 10.1007/s12274-017-1787-9
|
| [12] | German Institute for Standardization (2022) Load controlled fatigue testing—Execution and evaluation of cyclic tests at constant load amplitudes on metallic specimens and components. DIN 50100: 2022-12. |
| [13] | German Institute for Standardization (1990) Flexural fatigue testing of plastics using flat specimens. DIN 53442: 1990-09. |
| [14] | International Organization for Standardization (2003) Fibre-reinforced plastics—Determination of fatigue properties under cyclic loading conditions. ISO 13003: 2003. |
| [15] |
Evans AG (1974) Slow crack growth in brittle materials under dynamic loading conditions. Int J Fracture 10: 251–259. https://doi.org/10.1007/BF00113930 doi: 10.1007/BF00113930
|
| [16] |
Masuda M, Soma T, Matsui M (1990) Cyclic fatigue behavior of Si3N4 ceramics. J Eur Ceram Soc 6: 253–258. https://doi.org/10.1016/0955-2219(90)90052-H doi: 10.1016/0955-2219(90)90052-H
|
| [17] | Grenet L (1899) Recherches sur la résistance mécanique du verre: Mechanical strength of glass. Bulliten de la Societé d'Encouragement pour l'Industrie Nationale 5: 838–848. Available from: https://cnum.cnam.fr/pgi/redir.php?onglet = a & ident = BSPI. |
| [18] |
Gurney C, Pearson S (1948) Fatigue of mineral glass under static and cyclic loading. Philos T Roy Soc A 192: 537–544. https://doi.org/10.1098/rspa.1948.0025 doi: 10.1098/rspa.1948.0025
|
| [19] |
Lü BT (1997) Fatigue strength prediction of soda-lime glass. Theor Appl Fract Mec 27: 107–114. https://doi.org/10.1016/S0167-8442(97)00012-8 doi: 10.1016/S0167-8442(97)00012-8
|
| [20] |
Sglavo VM, Gadotti MT, Michelet T (1997) Cyclic loading behaviour of soda-lime silicate glass using indentation cracks. Fatigue Fract Eng M 20: 1225–1234. https://doi.org/10.1111/j.1460-2695.1997.tb00326.x doi: 10.1111/j.1460-2695.1997.tb00326.x
|
| [21] | Hilcken J (2015) Cyclic Fatigue of Annealed and Tempered Soda-Lime Glass, Berlin, Heidelberg: Springer. https://doi.org/10.1007/978-3-662-48353-4 |
| [22] |
Meyland MJ, Nielsen JH, Kocer C (2021) Tensile behaviour of soda-lime-silica glass and the significance of load duration—A literature review. J Build Eng 44: 102966. https://doi.org/10.1016/j.jobe.2021.102966 doi: 10.1016/j.jobe.2021.102966
|
| [23] |
Michalske TA, Freiman SW (1982) A molecular interpretation of stress corrosion in silica. Nature 295: 511–512. https://doi.org/10.1038/295511a0 doi: 10.1038/295511a0
|
| [24] |
Wiederhorn SM (1967) Influence of water vapor on crack propagation in soda-lime glass. J Am Ceram Soc 50: 407–414. https://doi.org/10.1111/j.1151-2916.1967.tb15145.x doi: 10.1111/j.1151-2916.1967.tb15145.x
|
| [25] |
Neugebauer J (2016) Determination of bending tensile strength of thin glass. Challenging Glass 5 Conference, 419–428. https://doi.org/10.7480/cgc.5.2267 doi: 10.7480/cgc.5.2267
|
| [26] | Heiß-Choquet M, Jotz M, Nattermann K, et al. (2014) Verfahren und Vorrichtung zur Bestimmung der Bruchfestigkeit der Ränder dünner Bahnen sprödbrüchigen Materials. German Patent DE 10 2014 110 855 B4. |
| [27] | Heiß-Choquet M, Jotz M, Nattermann K, et al. (2014)Verfahren und Vorrichtung zur Bestimmung der Kantenfestigkeit von scheibenförmigen Elementen aus sprödbrüchigem Material. German Patent DE 10 2014 110 856 B4. |
| [28] | Matthewson MJ, Kurkjian CR, Gulati ST (1986) Strength measurement of optical fibers by bending. J Am Ceram Soc 69: 815–821. https://doi.org/10.1111/j.1151-2916.1986.tb07366.x |
| [29] |
Gulati ST, Westbrook J, Carley S, et al. (2011) Two point bending of thin glass substrate. SID Int Symp Dig Tech Pap 42: 652–654. https://doi.org/10.1889/1.3621406 doi: 10.1889/1.3621406
|
| [30] |
Zaccaria M, Peters T, Ebert J, et al. (2022) The clamp bender: A new testing equipment for thin glass. Glass Struct Eng 7: 173–186. https://doi.org/10.1007/s40940-022-00188-8 doi: 10.1007/s40940-022-00188-8
|
| [31] | Langgemach W, Rädlein E (2024) A new method—Evaluation of the influence of coatings on the strength and fatigue strength of flexible glass. J Electron Mater (In press). |
| [32] | Schott AG (2022) AF32 eco: The alkali free answer to high technical demands, fact sheet. Available from: https://www.schott.com/de-de/products/af-32-eco-p1000308/downloads. |
| [33] | Schott AG (2023) D263T eco: The gold standard in imaging & sensing, fact sheet. Available from: https://www.schott.com/en-gb/products/d-263-P1000318/downloads. |
| [34] | Nippon Electric Glass Co., Ltd. (2024) Ultra-thin glass G-Leaf, fact sheet. Available from: https://www.neg.co.jp/en/assets/file/product/dp/en-g-leaf.pdf. |
| [35] | Corning Inc. (2019) The future is flexible: Corning willow glass, fact sheet. Available from: https://www.corning.com/media/worldwide/Innovation/documents/WillowGlass/Corning%20Willow%20Glass%20Fact%20Sheets_August2019.pdf. |
| [36] |
Juneja N, Tutsch L, Feldmann F, et al. (2019) Effect of hydrogen addition on bulk properties of sputtered indium tin oxide thin films. AIP Conf Proc 2147: 040008. https://doi.org/10.1063/1.5123835 doi: 10.1063/1.5123835
|
| [37] |
Stoney GG (1909) The tension of metallic films deposited by electrolysis. Proc R Soc Lond A 82: 172–175. https://doi.org/10.1098/rspa.1909.0021 doi: 10.1098/rspa.1909.0021
|
| [38] | Yuasa System Co., Ltd. (2023) Tension-free U-shape folding test. Available from: https://www.yuasa-system.jp/pdf/DLDMLH-FS_DLD-FS_en.pdf. |
| [39] |
Danzer R, Lube T, Supancic P, et al (2008) Fracture of ceramics. Adv Eng Mater 10: 275–298. https://doi.org/10.1002/adem.200700347 doi: 10.1002/adem.200700347
|
| [40] |
Mortazavian S, Fatemi A (2014) Notch effects on fatigue behavior of thermoplastics. Adv Mat Res 891–892: 1403–1409. https://doi.org/10.4028/www.scientific.net/AMR.891-892.1403 doi: 10.4028/www.scientific.net/AMR.891-892.1403
|
| [41] |
Prabhakaran R, Nair EMS, Sinha PK (1978) Notch sensitivity of polymers. J Appl Polym Sci 22: 3011–3020. https://doi.org/10.1002/app.1978.070221026 doi: 10.1002/app.1978.070221026
|
| [42] | Murakami Y (2002) Metal Fatigue: Effects of Small Defects and Nonmetallic Inclusions, 2 Eds., Cambridge, Massachusetts: Academic Press. https://doi.org/10.1016/C2016-0-05272-5 |
| [43] |
Neerinck DG, Vink TJ (1996) Depth profiling of thin ITO films by grazing incidence X-ray diffraction. Thin Solid Films 278: 12–17. https://doi.org/10.1016/0040-6090(95)08117-8 doi: 10.1016/0040-6090(95)08117-8
|
| [44] |
Mittelstedt C, Becker W (2004) Interlaminar stress concentrations in layered structures: Part Ⅰ—A selective literature survey on the free-edge effect since 1967. J Compos Mater 38: 1037–1062. https://doi.org/10.1177/0021998304040566 doi: 10.1177/0021998304040566
|
| 1. | Wiebke Langgemach, Matthias Fahland, Edda Rädlein, The influence of sputter-deposited indium tin oxide thin films on the strength of ultra-thin glass, 2024, 26665395, 100710, 10.1016/j.oceram.2024.100710 | |
| 2. | V. V. Tomaev, Yu. S. Tveryanovich, S. S. Lun’kov, S. A. Zaitseva, Influence of Metallophilic Interactions on Physicochemical Properties of the Ion-Conducting Glass System (1 – x)(0.27Sb2Se3–0.73GeSe2)–xAg2Se, 2024, 60, 1023-1935, 1254, 10.1134/S1023193524601505 | |
| 3. | Zhu Wu, Jianhui Xia, Transparent, Impact-Resistant Urethane-Siloxane Hybrid Coating with High Hardness and Exceptional Flexibility for Flexible Cover Windows, 2025, 2637-6105, 10.1021/acsapm.5c00281 |
Figures(16) / Tables(6)

Wiebke Langgemach, Andreas Baumann, Manuela Ehrhardt, Thomas Preußner, Edda Rädlein. The strength of uncoated and coated ultra-thin flexible glass under cyclic load[J]. AIMS Materials Science, 2024, 11(2): 343-368. doi: 10.3934/matersci.2024019

| ITO as deposited | Annealed ITO | ||
| Sputtering | Working pressure | 0.3 Pa | 0.3 Pa |
| Sputter power | 4 kW/m, DC mode | 4 kW/m, DC mode | |
| O2/(O2 + Ar+ H2) | 4.1% | 1.75% | |
| H2/(O2 + Ar + H2) | 3.3% | - | |
| Deposition rate | 29 nm·m/min | 28 nm·m/min | |
| Annealing | Atmosphere | - | Air |
| Temperature | - | 300 ℃ | |
| Relative humidity | - | 40% ± 5% at 20 ℃ | |
| Duration | - | 15 min | |
| Characteristics | Film thickness | 150 nm ± 10 nm | 150 nm ± 10 nm |
| Resistivity | 345 µΩcm | 255 µΩcm | |
| Thin film stress | −700 MPa | −1100 MPa | |
| Crystallinity | Amorphous | Crystalline | |
| Surface roughness Ra | 0.8 nm | 1.5 nm |
DownLoad:
CSV
| AR 1: SiO2-ZrO2 | AR 2: SiO2-ZrO2: Si | |
| Crystallinity | Monoclinic/tetragonal | X-ray amorphous |
| Crystallinity SiO2 | X-ray amorphous | X-ray amorphous |
| Thin film stress (ZrO2) | −347 MPa | −132 MPa |
| Thin film stress (stack) | −218 MPa | −263 MPa |
DownLoad:
CSV
| Load signal | Load type | R | Mean stress | Frequency | Specimen orientation |
| Highly non-linear | Pulsating (tensile) | 0 | 84 MPa … 402 MPa |
0.33 Hz … 0.42 Hz |
Cut/coated side under tensile stress |
DownLoad:
CSV
| Glass type | N (Ncensored) | Weibull modulus | σcrit in MPa | σ0 in MPa |
| AF32 | 30 (3) | 0.9 (0.7; 1.2) | 286 (187; 436) | 173 |
| D263T | 29 (8) | 0.8 (0.5; 1.1) | 490 (279; 858) | 173 |
| G-Leaf | 26 (6) | 1.3 (0.8; 2.2) | 430 (311; 593) | 112 |
| Willow glass | 22 (9) | 0.9 (0.6; 1.3) | 454 (287; 718) | 139 |
DownLoad:
CSV
| Sample | N (Ncensored) | Weibull modulus | σcrit in MPa |
| AF32 | 27 (3) | 1.8 (1.3; 2.4) | 516 (415; 640) |
| D263T | 21 (8) | 1.6 (1.1; 2.3) | 693 (529; 908) |
| G-Leaf | 26 (6) | 2.3 (1.7; 3.2) | 610 (515; 723) |
| Willow glass | 22 (9) | 1.6 (1.1; 2.2) | 616 (471; 805) |
| AF32 with ITO as dep. | 26 (4) | 11.8 (8.6; 16.1) | 742 (718; 767) |
| D263T with ITO as dep. | 23 (7) | 4.4 (3.1; 6.3) | 733 (669; 804) |
| AF32 with ITO annealed | 30 (0) | 5.0 (3.5; 7.0) | 520 (483; 560) |
| D263T with ITO annealed | 30 (0) | 2.1 (1.6; 2.8) | 371 (311; 443) |
| AF32 with AR 1 | 30 (0) | 5.6 (4.2; 7.3) | 403 (377; 431) |
| D263T with AR 1 | 30 (0) | 3.9 (2.9; 5.2) | 473 (429; 521) |
| AF32 with V2 | 30 (0) | 5.4 (4.1; 7.2) | 399 (373; 428) |
| D263T with V2 | 30 (0) | 4.5 (3.4; 5.9) | 444 (408; 483) |
DownLoad:
CSV
| Sample | N (Ncensored) | Weibull modulus | σcrit in MPa |
| AF32 | 30 (0) | 2.7 (2.1; 3.6) | 301 (262; 346) |
| D263T | 30 (0) | 2.4 (1.8; 3.2) | 279 (238; 328) |
| G-Leaf | 29 (0) | 2.3 (1.7; 3.2) | 286 (242; 339) |
| Willow glass | 30 (0) | 2.5 (1.9; 3.2) | 313 (268; 366) |
| AF32 with ITO as dep. | 30 (0) | 13.2 (9.4; 18.4) | 678 (658; 699) |
| D263T with ITO as dep. | 27 (1) | 3.2 (2.3; 4.3) | 585 (516; 662) |
| AF32 with ITO annealed | 27 (0) | 2.1 (1.4; 3.1) | 220 (180; 270) |
| D263T with ITO annealed | 29 (0) | 1.9 (1.3; 2.8) | 231 (187; 285) |
| AF32 with AR 1 | 29 (0) | 4.2 (3.2; 5.5) | 315 (287; 346) |
| D263T with AR 1 | 30 (0) | 5.7 (4.3; 7.6) | 390 (365; 417) |
| AF32 with V2 | 28 (0) | 6.8 (5; 9.1) | 299 (281; 317) |
| D263T with V2 | 30 (0) | 3.5 (2.5; 4.8) | 362 (325; 403) |
DownLoad:
CSV
| ITO as deposited | Annealed ITO | ||
| Sputtering | Working pressure | 0.3 Pa | 0.3 Pa |
| Sputter power | 4 kW/m, DC mode | 4 kW/m, DC mode | |
| O2/(O2 + Ar+ H2) | 4.1% | 1.75% | |
| H2/(O2 + Ar + H2) | 3.3% | - | |
| Deposition rate | 29 nm·m/min | 28 nm·m/min | |
| Annealing | Atmosphere | - | Air |
| Temperature | - | 300 ℃ | |
| Relative humidity | - | 40% ± 5% at 20 ℃ | |
| Duration | - | 15 min | |
| Characteristics | Film thickness | 150 nm ± 10 nm | 150 nm ± 10 nm |
| Resistivity | 345 µΩcm | 255 µΩcm | |
| Thin film stress | −700 MPa | −1100 MPa | |
| Crystallinity | Amorphous | Crystalline | |
| Surface roughness Ra | 0.8 nm | 1.5 nm |
| AR 1: SiO2-ZrO2 | AR 2: SiO2-ZrO2: Si | |
| Crystallinity | Monoclinic/tetragonal | X-ray amorphous |
| Crystallinity SiO2 | X-ray amorphous | X-ray amorphous |
| Thin film stress (ZrO2) | −347 MPa | −132 MPa |
| Thin film stress (stack) | −218 MPa | −263 MPa |
| Load signal | Load type | R | Mean stress | Frequency | Specimen orientation |
| Highly non-linear | Pulsating (tensile) | 0 | 84 MPa … 402 MPa |
0.33 Hz … 0.42 Hz |
Cut/coated side under tensile stress |
| Glass type | N (Ncensored) | Weibull modulus | σcrit in MPa | σ0 in MPa |
| AF32 | 30 (3) | 0.9 (0.7; 1.2) | 286 (187; 436) | 173 |
| D263T | 29 (8) | 0.8 (0.5; 1.1) | 490 (279; 858) | 173 |
| G-Leaf | 26 (6) | 1.3 (0.8; 2.2) | 430 (311; 593) | 112 |
| Willow glass | 22 (9) | 0.9 (0.6; 1.3) | 454 (287; 718) | 139 |
| Sample | N (Ncensored) | Weibull modulus | σcrit in MPa |
| AF32 | 27 (3) | 1.8 (1.3; 2.4) | 516 (415; 640) |
| D263T | 21 (8) | 1.6 (1.1; 2.3) | 693 (529; 908) |
| G-Leaf | 26 (6) | 2.3 (1.7; 3.2) | 610 (515; 723) |
| Willow glass | 22 (9) | 1.6 (1.1; 2.2) | 616 (471; 805) |
| AF32 with ITO as dep. | 26 (4) | 11.8 (8.6; 16.1) | 742 (718; 767) |
| D263T with ITO as dep. | 23 (7) | 4.4 (3.1; 6.3) | 733 (669; 804) |
| AF32 with ITO annealed | 30 (0) | 5.0 (3.5; 7.0) | 520 (483; 560) |
| D263T with ITO annealed | 30 (0) | 2.1 (1.6; 2.8) | 371 (311; 443) |
| AF32 with AR 1 | 30 (0) | 5.6 (4.2; 7.3) | 403 (377; 431) |
| D263T with AR 1 | 30 (0) | 3.9 (2.9; 5.2) | 473 (429; 521) |
| AF32 with V2 | 30 (0) | 5.4 (4.1; 7.2) | 399 (373; 428) |
| D263T with V2 | 30 (0) | 4.5 (3.4; 5.9) | 444 (408; 483) |
| Sample | N (Ncensored) | Weibull modulus | σcrit in MPa |
| AF32 | 30 (0) | 2.7 (2.1; 3.6) | 301 (262; 346) |
| D263T | 30 (0) | 2.4 (1.8; 3.2) | 279 (238; 328) |
| G-Leaf | 29 (0) | 2.3 (1.7; 3.2) | 286 (242; 339) |
| Willow glass | 30 (0) | 2.5 (1.9; 3.2) | 313 (268; 366) |
| AF32 with ITO as dep. | 30 (0) | 13.2 (9.4; 18.4) | 678 (658; 699) |
| D263T with ITO as dep. | 27 (1) | 3.2 (2.3; 4.3) | 585 (516; 662) |
| AF32 with ITO annealed | 27 (0) | 2.1 (1.4; 3.1) | 220 (180; 270) |
| D263T with ITO annealed | 29 (0) | 1.9 (1.3; 2.8) | 231 (187; 285) |
| AF32 with AR 1 | 29 (0) | 4.2 (3.2; 5.5) | 315 (287; 346) |
| D263T with AR 1 | 30 (0) | 5.7 (4.3; 7.6) | 390 (365; 417) |
| AF32 with V2 | 28 (0) | 6.8 (5; 9.1) | 299 (281; 317) |
| D263T with V2 | 30 (0) | 3.5 (2.5; 4.8) | 362 (325; 403) |
