Research article Special Issues

Characterisation and engineering properties of Dublin Boulder Clay—an update

  • In this paper, we present an update on the geotechnical characterisation and the geotechnical behaviour of the Dublin Boulder Clay, which is arguably the most important geotechnical material in the Republic of Ireland from an economic point of view. Despite its properties and the units within the material being well known, variations can occur, and detailed ground investigation is often warranted. The material is very strong and stiff and has a high content of coarse particles. Examples are given as to where triple tube rotary coring, combined with sub-sampling, can produce very good sample quality of the material for geotechnical testing. In situ testing is problematic though there appears to be some promise in shear wave velocity measurements and high-pressure dilatometer testing. Examples are given where the material is shown to behave very well in a wide range of geotechnical applications, e.g., for retaining walls and soil nails/ground anchors. Some examples of surprising behaviour of the material, e.g., unexpected rapid settlements and the impact of fissuring, are also outlined. Further work is required into the development of practical numerical constitutive models of the soil, especially for use in fully coupled undrained to drained analyses.

    Citation: Michael Long, Kevin Flynn, Chris Menkiti, Ronan Travers, Kieran Simpson, David Gill, Miles Friedman. Characterisation and engineering properties of Dublin Boulder Clay—an update[J]. AIMS Geosciences, 2025, 11(2): 387-441. doi: 10.3934/geosci.2025017

    Related Papers:

    [1] Jean-Sébastien L'Heureux, Anders Lindgård, Arnfinn Emdal . The Tiller-Flotten research site: Geotechnical characterization of a very sensitive clay deposit. AIMS Geosciences, 2019, 5(4): 831-867. doi: 10.3934/geosci.2019.4.831
    [2] Don J. DeGroot, Melissa E. Landon, Steven E. Poirier . Geology and engineering properties of sensitive Boston Blue Clay at Newbury, Massachusetts. AIMS Geosciences, 2019, 5(3): 412-447. doi: 10.3934/geosci.2019.3.412
    [3] Robert Radaszewski, Jędrzej Wierzbicki . Characterization and engineering properties of AMU Morasko soft clay. AIMS Geosciences, 2019, 5(2): 235-264. doi: 10.3934/geosci.2019.2.235
    [4] Paul W. Mayne, Ethan Cargill, Bruce Miller . Geotechnical characteristics of sensitive Leda clay at Canada test site in Gloucester, Ontario. AIMS Geosciences, 2019, 5(3): 390-411. doi: 10.3934/geosci.2019.3.390
    [5] Santiago Quinteros, Aleksander Gundersen, Jean-Sebastien L'Heureux, J. Antonio H. Carraro, Richard Jardine . Øysand research site: Geotechnical characterisation of deltaic sandy-silty soils. AIMS Geosciences, 2019, 5(4): 750-783. doi: 10.3934/geosci.2019.4.750
    [6] David Igoe, Kenneth Gavin . Characterization of the Blessington sand geotechnical test site. AIMS Geosciences, 2019, 5(2): 145-162. doi: 10.3934/geosci.2019.2.145
    [7] Priscilla Paniagua, Marco D'Ignazio, Jean-Sébastien L'Heureux, Tom Lunne, Kjell Karlsrud . CPTU correlations for Norwegian clays: an update. AIMS Geosciences, 2019, 5(2): 82-103. doi: 10.3934/geosci.2019.2.82
    [8] Øyvind Blaker, Roselyn Carroll, Priscilla Paniagua, Don J. DeGroot, Jean-Sebastien L'Heureux . Halden research site: geotechnical characterization of a post glacial silt. AIMS Geosciences, 2019, 5(2): 184-234. doi: 10.3934/geosci.2019.2.184
    [9] Aleksander S. Gundersen, Ragnhild C. Hansen, Tom Lunne, Jean-Sebastien L’Heureux, Stein O. Strandvik . Characterization and engineering properties of the NGTS Onsøy soft clay site. AIMS Geosciences, 2019, 5(3): 665-703. doi: 10.3934/geosci.2019.3.665
    [10] Don J. DeGroot, Tom Lunne, Ravindra Ghanekar, Siren Knudsen, Cody D. Jones, Tor Inge Yetginer-Tjelta . Engineering properties of low to medium overconsolidation ratio offshore clays. AIMS Geosciences, 2019, 5(3): 535-567. doi: 10.3934/geosci.2019.3.535
  • In this paper, we present an update on the geotechnical characterisation and the geotechnical behaviour of the Dublin Boulder Clay, which is arguably the most important geotechnical material in the Republic of Ireland from an economic point of view. Despite its properties and the units within the material being well known, variations can occur, and detailed ground investigation is often warranted. The material is very strong and stiff and has a high content of coarse particles. Examples are given as to where triple tube rotary coring, combined with sub-sampling, can produce very good sample quality of the material for geotechnical testing. In situ testing is problematic though there appears to be some promise in shear wave velocity measurements and high-pressure dilatometer testing. Examples are given where the material is shown to behave very well in a wide range of geotechnical applications, e.g., for retaining walls and soil nails/ground anchors. Some examples of surprising behaviour of the material, e.g., unexpected rapid settlements and the impact of fissuring, are also outlined. Further work is required into the development of practical numerical constitutive models of the soil, especially for use in fully coupled undrained to drained analyses.


    We present some details on the geotechnical characteristics of Dublin Boulder Clay (DBC), based on detailed ground investigation and site experience from some recent large projects in Dublin. Dublin (population 1,285,000) is the capital city of the Republic of Ireland (population 5.262 million), and DBC is the most important geotechnical material from an economic point of view. Some work has been published on the characteristics of the material, e.g., by Farrell and Wall [1], Long and Menkiti [2], and Long and Menkiti [3].

    However, in the 20 years or so since this work, new data has become available from comprehensive ground investigations, which include high-quality rotary coring and detailed laboratory testing, in situ geophysical testing and high-pressure dilatometer testing (HPD), amongst others. Large ground investigations have been undertaken for a number of tunnelling projects. In addition, there has been a comprehensive study of the behaviour of the material in engineering works. This includes retaining wall behaviour, settlements due to tunnelling, pull-out tests on soil nails and anchors, and observations of material behaviour in steep cuts.

    DBC is a high-strength, stiff material with a high content of coarse particles. It also shows a very low tendency to swelling. The material dilates significantly on shearing. This behaviour made numerical modelling, particularly full coupled consolidation/shearing behaviour, difficult to model though some work has been performed in this regard.

    Here, we present an update on the geotechnical characteristics and engineering properties of the material from the point of view of a range of industry experts, including consulting engineers, a contractor, a client representative, and those in academics.

    A detailed description of the bedrock geology of the area is outside the scope of this paper, and the reader is referred to Marchant and Sevastopulo [4], Farrell and Wall [1], or Skipper et al. [5]. Nevertheless, from the point of view of a discussion on the geotechnical aspects of DBC, it is important to note that there are broadly two bedrock types found in the area. The majority of the Dublin City area is underlain by an argillaceous limestone of Lower Carboniferous age, colloquially known as "Calp". It is thought that the limestone was deposited in a shallow marine environment and that cyclical changes in the water depth and depositional conditions led to significant changes in the rock properties and thickness. In particular, regular inclusions of shale or mudstone layers, occasionally weathered to clay, are found.

    The city is bounded in the south by the upland Leinster granite region of the Wicklow Mountains. According to the mapping of the Geological Survey Ireland (GSI) (www.gsi.ie), these are Siluro-Devonian granitic rocks and appinite. The surface layer of these rocks is often weathered to a coarse-grained sand and gravel deposit. An approximate location of the bedrock interface, from the point of view of projects present here, is shown in Figure 1. For details, the reader is referred to www.gsi.ie.

    Figure 1.  Test site locations and outline geology. The figure is a modified form of that shown in [3].

    Broadly speaking, DBC is hard lodgement till, which was deposited beneath the ice sheet that covered much of Ireland during the Pleistocene period (Figure 1). It is thought that ice thickness in Dublin was approximately 1 km and that several advances and retreats of the glaciers occurred in the area [1]. The grinding action of this ice sheet as it eroded the underlying rocks, together with its loading effect, resulted in the formation of a stiff to hard low-permeability deposit, which contains pockets or lenses of coarse gravel. It contains a wide range of soil particle sizes from fine to very coarse (i.e. clay, silt, sand and gravel, including cobbles and boulders), and as such is a composite soil. It predominantly behaves as a fine-grained soil, and in its behaviour is matrix-dominated [6]. An image of the DBC (from an excavation on Clarendon St., Central Dublin) is shown in Figure 2 and illustrates the compact nature of the material and its dominant coarse particle content.

    Figure 2.  Exposure of DBC (UBkBC) at a site on Clarendon St., Central Dublin. Approximate dimensions of a SPT or CPT tool are shown.

    A significant geological feature found in the north city centre area is a buried pre-glacial channel north of the River Liffey [7,8]. Work by Kealy et al. [9] has shown that in the central city area, the channel is typically 1 km wide and 45 m deep and is infilled with glacio-fluvial deposits consisting of water-bearing medium to very dense slightly sandy to sandy gravel. A smaller glaciofluvial channel has also been identified in the south inner city near Grand Canal Dock.

    The most comprehensive early general characterisation of DBC was given by Farrell and Wall [1]. Supplementary work by Farrell et al. [10] made the differentiation between the upper Brown Boulder Clay the lower Black Boulder Clay. These researchers stated that the Brown Boulder Clay is a weathering product of the Black Boulder Clay but is broadly similar to it in terms of particle size distribution. They also suggest that there can be some local variation in colour of the Black Boulder Clay, causing it to become lighter and browner in colour.

    Skipper et al. [5] provided an updated understanding of the geology of the DBC based on work for the Dublin Port Tunnel (DPT) project. Their conclusions were based on extensive laboratory and in situ testing, but most importantly, on the examination of exposures at DBC at the Northern Cut and Cover section of the project. These researchers interpreted four distinct formations of the DBC an Upper Brown Boulder Clay (UBrBC), an Upper Black Boulder Clay (UBkBC), a Lower Brown Boulder Clay (LBrBC), and finally a Lower Black Boulder Clay (LBkBC). A detailed account of these deposits can be found in the original paper, but a brief description is given as follows.

    The UBrBC is the "Brown DBC" of Farrell et al. [10]. It is relatively thin and can be described as a firm to stiff to very stiff yellowish-brown, slightly sandy, slightly gravelly silty clay with some cobbles. Similarly, the UBkBC is the "Black Boulder Clay" of [10]. It can be of the order of 12 m in thickness and is characteristically a very stiff, dark grey to black, slightly gravelly, slightly sandy clay with some cobbles. Some important characteristics of the material, from a geotechnical point of view, are that, once it is excavated or disturbed, its fabric contains a number of discontinuities in the form of sub-vertical, rough and very tightly closed fissures allowing the excavated material to break into peds (see Section 7.4). The material also contains permeable lenses, which can have very significant implications for its engineering behaviour, especially in cut slopes [11] and retaining walls [12]. Geologically, both the UBrBC and the UBkBC are diamictons and can be termed "lodgement tills".

    The LBrBC has been studied in most detail at the Dublin Port Tunnel site. There it is a 5 m to 9 m thick, hard brown, slightly sandy, slightly gravelly clayey silt with cobbles and boulders. It has been called the "sandy boulder clay" as it is similar to but siltier than the UBkBC above. Skipper et al. [5] sub-divided the LBrBC into three sub-units. The upper and lower units are characterised as diamictons, which have many of the same features as the UBkBC and are also interpreted as lodgement tills. The most variable middle unit is mostly composed of laminated sediments, which were deposited in a lake or shallow estuarine environment, possibly during a period of climate warming and thus has a different genetic origin than the other units.

    Finally, the LBkBC is usually less than 4 m in thickness. It is also a lodgement till and can be described as a very stiff, dark grey to black, slightly sandy, slightly gravelly clayey silt with cobbles and boulders. It is generally blacker and more plastic and contains more angular clasts than the UBkBC. Occasionally rafts of limestone can be found within the LBkBC. These are of importance in ground investigations and design as they can be mistaken for intact bedrock ("false" rockhead).

    Along with the DPT site, all four units have been identified at the site of the proposed Children's Hospital of Ireland at the Mater Hospital [2]. Later, the project was moved to another site at St. James' hospital. South of the River Liffey, the third unit (LBrBC) appears to be absent for example, at the University College Dublin, Tallaght Town Centre and Dáil Éireann sites as reported by Long and Menkiti [2]. It is clear that further work is required to define the distribution and the variation in engineering properties of the various units of the DBC throughout the city and surrounding areas.

    In the following sections, data will be presented from some well-characterised sites across the area to address this uncertainty. Six sites have been chosen. Two of these are just south of the City Centre on St. Stephen's Green, where the conditions are "typical" for Dublin, and the objective is to examine how ground properties vary across short distances. Two sites further south of the city are then examined at Montrose and at Cherrywood. The bedrock at the latter site is granite as opposed to limestone, and where anecdotally the DBC is very stiff and strong. The fifth site is at Grangecastle to the west of the city, where the rock is relatively shallow, and the DBC is thought anecdotally to be variable. Finally, some data from a site in O'Connell St. at the centre of the city near the buried pre-glacial channel is presented, illustrating a site with complex conditions. The location of these sites is shown in Figure 1.

    Significant ground investigation works were undertaken between 2006 and 2007 for the proposed Metro North project. Later, the project was revised and is now known as MetroLink (https://www.metrolink.ie/). The proposed Metro North St. Stephen's Green station was along the west side of the park near the existing LUAS light rail stop and is dealt with in this section. The proposed MetroLink St. Stephen's Green station is located on the opposite eastern side of the site (see Section 3.2). Ground level in the St. Stephen's Green is approximately +12 mOD.

    The GSI mapping of the area shows it to be underlain by made ground over tills derived from limestone. Some index properties comprising water content, bulk density, plasticity index, and uncorrected standard penetration test (SPT) N values are shown in Figure 3. Data from the two investigations by Irish Geotechnical Services Ltd. (IGSL) and Norwest Holst, using a combination of Geobore S and cable percussive boreholes, are shown in addition to average values (dashed lines) for the UBkBC from the DPT Northern Cut and Cover project [3].

    Figure 3.  Index properties for St. Stephen's Green (west) site (a) water content, (b) bulk density, (c) plasticity index, and (d) SPT tests.

    Findings from the investigation confirm the data on the GSI mapping. Approximately 1.3 m of made ground overlies an average of 5.0 m of boulder clay, over 1.5 m of gravels (likely a subglacial channel). Limestone bedrock can be found at about 9 m on average. The boulder clay can be divided into two units, an upper brown boulder clay (UBrBC), which has higher water content, higher plasticity and lower undrained shear strength than the underlying black boulder clay (UBkBC). There is little difference between the data from the two ground investigations. The IGSL SPT values are lower, and the variation is likely due to energy loss in the different hammers. Above 5.5 m, the boulder clay has approximately the same average values as those for the DPT UBkBC. However, below 5.5 m, the values of water content are significantly larger. A similar finding was made for the plasticity index (indicating intermediate plasticity), and consistent with this, the bulk density values below 5.5 m are lower than average.

    The likely presence of a deeper unit within the boulder clay is confirmed by the plasticity chart in Figure 4. Many of the points are typical of the DPT UBrBC/UBkBC, but there is a second group of data points, all from below 5.5 m depth, where the liquid limit and plasticity values are higher. It is possible that this material is LBrBC (similar to that seen in the O'Connell St project on Section 3.6), but further data is required to confirm this. Also shown on the plasticity chart is the T-line after [6] and [13]. According to these researchers, many data points for British tills straddle this line, and this can also be seen for the DBC here.

    Figure 4.  Plasticity chart for St. Stephen's Green (west) site.

    Unfortunately, only one deep particle size distribution test is available from the site (Figure 5), but this again shows a higher clay and silt content than the main body of the data, which is consistent with the higher plasticity. The majority of the curves follow a similar pattern to the range from DPT. It would seem possible that this deeper layer of boulder clay at the St. Stephen's Green site is very similar to the LBkBC from the DPT (and Mater Hospital) sites.

    Figure 5.  Particle size distribution tests for St. Stephen's Green (west) site.

    MetroLink is a proposed 18.8 km light rail scheme, mostly in the tunnel, connecting the city centre with Swords in north County Dublin via Dublin Airport. Extensive ground investigations were carried out by Causeway Geotech in 2019 (NBH series) and 2022 (ABH series). The proposed MeroLink station at St Stephen's Green is approximately 250 m to the east of the Metro North location (Section 3.1). Five Geobore S boreholes (2 NBH and 3 ABH) were carried out at the site.

    Although the two St. Stephens' Green sites are only separated by 350 m, it is interesting to examine how much the parameters of the material vary across short distances. It is also worth noting that a third contractor (Causeway Geotech) was involved, which was different from the two who worked at the western site. A similar set of plots, as for St. Stephen's Green west are shown on Figures 6, 7, and 8. The details of the geology and ground conditions and the values of the DBC parameters are similar, with the UBrBC and UBkBC units being present. There is, unfortunately, only limited data below 5.5 m with which to explore the presence of LBrBC at this location. The borehole logs also reveal a second layer of DBC beneath the fluvio-gravel stratum, but no index testing is available for this layer.

    Figure 6.  Index properties for St. Stephen's Green East/MetroLink site (a) water content, (b) bulk density, (c) plasticity index, and (d) SPT tests.
    Figure 7.  Plasticity chart for St. Stephen's Green East/MetroLink site.
    Figure 8.  Particle size distribution tests for St. Stephen's Green East / MetroLink site.

    The properties of the DBC at the St. Stephen's Green East site are very similar to those of the UBrBC and UBkBC at the western site and also those of the UBkBC at the DPT site.

    This is the site of a proposed residential development, some 4.5 km south/south-west of the city centre. Ground level was typically around +14 mOD. Index data and a tentative ground model for the site based on 23 boreholes drilled using the hollow stem auger (a combination of auger, clay samplers and rotary drilling below about 5.5 m in the both the DBC and rock) and three Geobore S boreholes with sub-sampling, performed by Geotechnical Environmental Services Ltd. in 2008 and 2018, are shown in Figure 9.

    Figure 9.  Index properties for the Montrose site (a) water content, (b) bulk density, (c) plasticity index, and (d) SPT tests.

    The site is underlain by typical Dublin conditions with Made Ground over DBC over limestone bedrock at an average depth of about 8.5 m. Unlike some of the other sites, two distinct units within the Upper Brown Boulder clay (UBrBC) are observed. These units are around 0.75 m and 1.0 m in thickness. The intermediate plasticity samples were associated with silt-dominated UBrBC, which is a common observation made on other sites. The lower unit has a lower water content and higher strength, and its properties are less variable than the upper unit. This is confirmed by the plasticity chart in Figure 10 and suggests that the formation is more pedogenically altered (or weathered) closer to the ground surface. Interestingly, this sub-unit within the UBrBC is usually missing, likely removed, in brownfield sites in central Dublin due to historical development. The properties of the lower unit are very similar to those of the DPT project.

    Figure 10.  Plasticity chart for the Montrose site.

    The UBkBC properties are again very similar to those from the DPT project, but there is a distinct change in the material properties below a depth of around 6.5 m, which is likely to be the LBkBC. This is broadly consistent with the findings of [5], who noted that in contrast to the UBkBC, the LBkBC is blacker, more plastic and shows an increase in cobbles and boulders, particularly close to the limestone contact. Unlike in Grangecastle (Section 3.5), there were no gravel layers at the basal content with the rock; however, examination of the core photos indicates evidence of increased coarse particle (stone) content close to this interface. There is also evidence from two boreholes, towards the west of the site, of the presence of LBrBC, though no lab testing is available to confirm.

    The data also indicates that the other key differentiator between the UBkBC and LBkBC is the increase in density, with the SPT N-value providing a simple way of assisting the practitioner in distinguishing the two formations. This is corroborated by the UU triaxial testing, which indicates an extremely high-strength clay, despite the results for this site being on the low side of the data set shown in Section 6.3. The material at this site also has exceptionally high bulk unit weight being close to that of concrete.

    A similar set of data for the Cherrywood site, some 13.5 km south/south-west of the city centre, in south Dublin, is shown in Figures 11, 12, and 13. The Cherrywood area is at some +50 mOD to +55 mOD and is underlain by granite bedrock in contrast to the other sites, where the bedrock is the "calp" limestone. Clasts of granite are evident in the material. Anecdotally, the DBC at Cherrywood is known to be exceptionally strong and stiff. An example of a triaxial test from Cherrywood is given in Section 6.2.3.

    Figure 11.  Index properties for Cherrywood site (a) water content, (b) bulk density, (c) plasticity index, and (d) SPT "N". Data from two ground investigations by SIL (Site Investigations Ltd.) and IGSL are shown. For the SPT tests, there is also data from both cable percussion holes (BH) and rotary cored holes (RC). The dashed lines in figures (a) and (b) correspond to average values of the UBkBC from the DPT project.
    Figure 12.  Plasticity chart for Cherrywood.
    Figure 13.  Particle size distribution tests for Cherrywood.

    The material appears to be uniform at this site, with no clear evidence of different DBC units. However, there is limited classification testing below 8 m. The lower SPT's at shallow depth are consistent with a UBrBC unit being present. From the authors' experience of other projects in the Cherrywood development area, not presented here, UBrBC is present and overlies the UBkBC. Values of water content are in line or perhaps slightly lower than those from the UBkBC at the DPT site, but at Cherrywood, the plasticity values are lower and the density values are higher than at the DPT site. Similar to St. Stephen's Green, above the data points on the plasticity chart straddle the T-line as expected for glacial tills. The average bulk density is 2.37 Mg/m3, an exceptionally high value. More than 50% of the SPT tests in the material showed "refusal", or the tests were abandoned when a blow count of 50 was achieved, indicating the high strength of the material, as was expected.

    A comprehensive ground investigation was undertaken in 2021 by Causeway Geotech Ltd. as part of a large industrial development in Grangecastle, West Dublin. The average ground level prior to construction was +67.8 mOD. The typical downward geological sequence was made ground/topsoil, DBC, overlying Limestone bedrock. A variable rockhead between 1.4 m to 5.6 m below ground level was encountered across the site, resulting in a thin deposit of DBC compared to central Dublin. Groundwater was measured close to the ground surface and flowed towards the Griffeen River, which bounded the northern boundary of the site.

    At this site, there was a focus on distinguishing between the UBrBC and the UBkBC. Water content, plasticity index, and SPT N values are presented in Figure 14, and the plasticity chart is shown in Figure 15. UBrBC was identified in all exploratory locations, except where disturbed by previous construction activities on the site. Layers of slightly sandy, slightly gravelly clayey silt are present and correspond to the intermediate plasticity data points on Figure 15. There is significant scatter in the data, and values of water content and plasticity exceed the average determined for the DPT site. Both parameters generally decrease with depth below ground level. This variability can be attributed, in part, to the shallow bedrock and the intermittent presence of the two units of Black Boulder Clay, suggesting a complex geological environment. UBkBC was identified in most locations but was generally absent where the rock was shallow. Its properties again show generally higher values than for the DPT project. Notably, two values plotted as intermediate plasticity, both from samples within 0.4 m of rockhead, and were described as slightly sandy, slightly gravelly clayey silt, which is likely the LBkBC (and is consistent with the details given in Section 2.4). The UBkBC fits better than the UBrBC into the broader stratigraphical framework described by Farrell and Wall [1]. Some of the features described by Skipper et al. [5] for LBkBC close to the contact zone with the bedrock were encountered, such as the presence of subangular limestone cobble clasts and gravel lenses, which are possibly subglacial channel deposits at the base of the glacier.

    Figure 14.  Index properties for Grangecastle site (a) water content, (b) plasticity index, (c) uncorrected SPT "N", and (d) corrected SPT N60.
    Figure 15.  Plasticity chart for Grangecastle.

    Although the material shows a similar diamicton-type particle size distribution to those from the other sites, the materials are slightly coarser and have slightly higher fine content (Figure 16). This is consistent with the higher values recorded for the index properties.

    Figure 16.  Particle size distribution tests for Grangecastle.

    Both uncorrected and corrected SPT's are shown in Figure 14. SPT N-values (N60) have been corrected for hammer energy losses based on calibration certificates provided by the contractor for each hammer. This has helped to reduce some of the scatter presented, in particular the lower values. Below 1 m depth, N60 is recorded between 12 and 32 blows/300 mm, equating to medium to high strength clay. A key difference between the UBrBC and the UBkBC is the high N60 values recorded, with a significant number refusing at 50, indicating a high-strength clay.

    Finally, some data is presented for the Dublin Central Project site in O'Connell St. in Figures 17 and 18. The site is at about +5 mOD and is close to the southern boundary of the gravel-filled, pre-glacial trench discussed in Section 2.2 above. The site is underlain by a complex sequence of strata, possibly very similar to the full sequence of strata proven at the Dublin Port Tunnel northern cut and cover site, which is 4 km to the north/north-west. A layer of dark brown boulder clay (likely to be UBkBC based on low water contents and high SPT's) overlies a thick gravel sequence over the LBrBC and the LBkBC. Two units of the LBrBC are likely to be present. The presence of the laminated silt layer is consistent with the deepest part of the LBrBC in the DPT site and on the St. Stephen's Green west site (Figure 3). The parameters of the material are much more variable than elsewhere. However, the materials have very high density and high strength, with many "refusals" being recorded in the SPT testing.

    Figure 17.  Index properties for Dublin Central project site (a) water content, (b) bulk density, and (c) SPT "N".
    Figure 18.  Plasticity chart for the Dublin Central project.

    The important message from this site is that despite the ground conditions in the city being well known, some complex conditions can also be encountered, and there is always a clear need for detailed ground investigation.

    The results of some simple statistical analyses of the variation in the parameters of the UBrBC and the UBkBC are shown in Figure 19. Average values of water content, plasticity index, and bulk density for the two materials for the 6 sites discussed above are presented and compared to the average values from the DPT project, and some values from general experience in Dublin reported by Lehane and Simpson [14]. Some further statistical data in the form of average values, standard deviation, and number of data points are presented in Appendix A, Table A of this paper.

    Figure 19.  Some statistical analysis of water content (a and b), plasticity index (c and d), and bulk density (e) for UBkBC and UBrBC.

    In general, the measured values are very much in line with those reported previously. There does seem to be a trend in a reduction in water content and plasticity index and an increase in density from the city centre area to the south. This is consistent with anecdotal evidence of working with the material. Most scatter occurs in the value of the plasticity index. This is perhaps not surprising given the nature of the test. The least scatter is recorded in the bulk density values.

    In general, it would seem that the upper two units of the DBC, as identified by [5], namely the UBrBC and the UBkBC, are usually found, except where a deep layer of made ground is present. The UBrBC is, of course, thought to be a weathered version of the UBkBC. At the Montrose site, two sub-units within the UBrBC were clearly proven. The properties of the UBrBC can be very variable with layers of intermittent silt-dominated boulder clay resulting in intermediate to high plasticity material. This material is often wet of optimum, as is evident from the higher water contents, and cannot be classified as a Transport Infrastructure Ireland (TII) Class 2C engineering fill without processing.

    In the sites studied, the properties of the UBkBC are often very similar. However, random lenses/layers of gravel and sand can be found within the UBkBC, rendering its behaviour more complex. Based on the index testing presented, the boulder clays at the Cherrywood site, which are described on the GSI mapping as being underlain by till derived from granite, have similar index properties as UBkBC. There is evidence that LBkBC was encountered close to the contact with the bedrock at most sites but was found as a discontinuous layer. Notable features include higher coarse particle content, lenses of gravels, changes in plasticity, and higher silt dominated layers. The LBrBC is not always encountered.

    In conclusion, despite the material being relatively well understood, there is a clear need for comprehensive ground investigation at new sites, particularly for projects involving deep excavations or heavy loading. This point is borne out by the complex conditions encountered at the Dublin Central project in O'Connell St. and Grangecastle. Detailed stratigraphical records, based on Geobore S coring, for example, combined with a simple index testing, have been shown to sufficiently characterise the different units of DBC. Furthermore, it is recommended that SPT N values are corrected for energy loss to reduce scatter.

    DBC, similar to other glacial tills, is a spatially variable, composite soil with high strength and coarse content, and as such, is difficult to sample. Geotechnical laboratory testing to determine shear strength, stiffness, and consolidation properties requires Class 1 sample quality using a Category A sampling method to comply with ENISO [15] (Annex H.1.1).

    Thick-walled open tube samplers such as U100 are commonly used during cable percussion borehole drilling, particularly in the UK. These tubes are driven in place; however, recovering samples in high-strength DBC is challenging, particularly when a high content of coarse particles is present. Damage to the cutting shoes can easily occur. This technique has limited ability to obtain samples over the full layer thickness of DBC.

    Thick-walled, open tube samplers are considered a category B/C sampling method, ENISO [15] and result in lower sample quality. The use of a liner with this sampling tube increases the area ratio and reduces the sample quality further. As such, they are not suitable to determine consolidation, shear strength, and stiffness properties and thus are suitable only for index testing.

    Rotary core drilling using geotechnical wireline S size (102 mm diameter) core barrels, typically with a biodegradable polymer gel flush (sometimes air mist is used) used to enhance recovery, known as Geobore S, has been successfully used in DBC combined with sub-sampling on site to achieve Class 1 sample quality. This is a triple-barrel wireline coring system. The third barrel is a tight-fitting liner tube inside the inner barrel. This inner liner usually comprises a thin, clear plastic tube. It enables the recovered core to be easily and quickly withdrawn from the core barrel, and the core can be stored in the liner to minimize further disturbance.

    The Geobore S system also includes a wireline component. This means that the inner barrel can be lowered and raised using a steel wire without withdrawing the outer barrel. This enables the newly cored sample to be quickly retrieved and removed from the drilling fluid-filled bore, thereby minimizing softening and associated destructuring and sample disturbance. Moreover, the outer barrel stays in contact with the length of the borehole and fully encases the system, mitigating the risk of borehole collapse. Wireline techniques improve the drilling and sampling time [16]. Like a double-barrel system, flush fluid is used and is passed between the outer and inner barrels. The wireline system also enables SPTs to be undertaken in rotary core boreholes using Geobore S, thus providing additional information if the recovered core is unsuitable for triaxial testing.

    It is typical for hand-excavated pits to be undertaken to a depth of around 1.2 m below ground level at each borehole prior to the commencement of drilling. In addition, Geobore S will need to be embedded at least 1 m into clay to allow circulation of the drilling fluid. A limitation of Geobore S is that coring can commence only approximately 1.5 m below ground level.

    Reference is also made to earlier work where a comparison is made between tests on hand-carved block samples of DBC and on Geobore S cores [2]. This work confirmed that, from the point of view of practicing engineers, Geobore S coring and block sampling both provide high-quality samples from which the results of the strength and stiffness tests are representative of the in situ conditions.

    As will be discussed in Section 6.3, the strength of DBC is susceptible to small changes in water content. A key step in achieving Class 1 sample quality is to immediately sub-sample the core, ideally on site, to preserve the natural water content. Following the splitting of the liner, a segment of the core run is chosen, typically between 300 mm and 400 mm in length. Core, which contains cobbles or significant coarse gravel, should be avoided. The core is typically cut using a hammer and chisel. Alternatively, a rotating saw can be used, but due to the cutting process, any residual suction close to the ends may be removed [3]. A method of sealing the sample has been applied to several projects over the last eight years. It was used as part of the work by Simpson [17] and is described as follows:

    1. The sample is wrapped in heavy-duty plastic (e.g., cling film). The purpose of the plastic is to stop the hot wax from sticking to the sample.

    2. The sample is then dipped by hand in a bath of low melting point wax and rotated until it is covered by wax. It may prove necessary to dip the ends of the sample in wax as a separate action first then allow some cooling before completing the remainder of the sample.

    3. The wax is allowed to cool. Once solidified, the sample is wrapped tightly in heavy-duty plastic for a second time. The cling film is then overlapped by at least 30 mm onto both ends of the sample before wrapping.

    4. Then, each end of the sample is wrapped tightly in heavy-duty cling film. The cling film is overlapped by at least 30mm onto the curved surface of the sample.

    5. Depending on the circumstance, additional layers of wax and plastic may be required.

    6. The sample is then placed in a section of core liner and labelled.

    Sample disturbance effects have been assessed using the methods proposed by Kleven et al. [18] and by Lunne et al. [19]. The former method uses the index ΔV/V0, which is the volume change that occurs during reconsolidation compared with the initial sample volume, and the latter approach uses the index Δe/e0, which represents the normalised void ratio change when reconsolidating a sample to the best estimate of the in situ stress. These researchers suggest that it is a more reasonable parameter to use, as this parameter is a measure of the change in pore volume to the initial pore volume, while ΔV/V0 is equal to the change in pore volume divided by the initial total volume. They based their argument on the assumption that a certain change in pore volume will be increasingly detrimental to the particle skeleton as the initial pore volume decreases.

    It is important to note that both these criteria were developed from tests on marine clay samples for depths up to 25 m, with plasticity index in the range 6–43%, water content in the range 20% to 67% and overconsolidation ratio (OCR) between 1 and 4. The authors point out that the criteria should be treated with caution for material outside these ranges.

    Data for Geobore S samples of DBC, taken from Simpson [17], are shown in Figure 20a and 20b. Simpson included an exploration of the effect of the elapsed time between drilling and sub-sampling of the 102 mm diameter cores. Three cases were studied: Immediate sub-sampling, and for 1 day and 6 days after drilling. The relevant values for OCR 1.5–2 and 2–4 are used for the Kleven et al. [18] method and the Lunne et al. [19] method, respectively. For the former criterion, all the data fall in the "very good test" range. All but two of the data points fall in the "very good to excellent" range for the Lunne et al. [19] approach. Figure 20c focuses on the time between the field sampling and the subsequent sub-sampling. While there is some scatter in the data, in general, it can be seen that the samples, which were sub-sampled immediately, are best, and those where there was some time in between are of poorer quality. The impact of this waiting period will be examined in conjunction with the undrained shear strength values later. It is also clear that this method of assessing sample disturbance for DBC needs review, as, for example, some 6-day sub-samples fall within the "very good to excellent" category. Section 6.3.2 discusses the effects on undrained shear strength due to sample timings.

    Figure 20.  Assessment of sample disturbance effects (a) using the criterion of Kleven et al. (1986), (b) using the criterion of Lunne et al. (1997), and (c) as (b) but with a focus on time between sampling and sub-sampling.

    The well-known publication of Stroud [20] has long been used to determine engineering design parameters of Irish glacial tills. Stroud's database included some UK tills that are likely weaker and less stiff than the Irish tills and, therefore, it is accepted that the approach is probably conservative.

    Stroud's work was updated by White et al. [21] who found the original Stroud value for f1 (undrained shear strength; cu = f1*N60, where f1 is a factor in kN/m2 and N60 is the corrected SPT number in Blows/300 mm) underestimated cu for London clay. They proposed f1 could be increased by 25–35%. They suggested the change in f1 could be due to changes in the way the SPT has been carried out since the original work. Although no detailed study has been carried out, f1 = 5 to 6 is typically used in practice for Dublin Bulder Clay, corresponding to a low plasticity material. The use of N60 (correct SPT N value) also reduces the scatter where different SPT hammers are used on site (see Section 3.5).

    CPTU testing in DBC is reported by O'Kelly [22] following the work by Faulkner et al. [23] and Sivakumar et al [24]. Data from three sites are given in these papers. All tests were carried out using a standard 10 cm2 piezocone and a 20 t CPT truck. Depths of penetration of 2.5 m, 3.3 m, and 4.7 m, approximately, were achieved. The limited depth ranges are not surprising given the very stiff nature of the material and its high content of coarse particles (Figure 2). The tests did show that the cone end resistance (qc) and the sleeve friction (fs) both increased with depth and that there was a significant "step" in the data at the boundary between the UBrBC and the UBkBC. The data was very scattered with frequent "spikes". Generated pore pressures (u2) were often negative, particularly when coarse layers were encountered.

    Given the composite nature of the material, it would appear that CPTU testing in DBC is of limited use. It may, however, be worth trying to interpret the data using some novel machine learning based methods such as those suggested by the researchers in [25] or [26].

    Some high-pressure dilatometer tests (HPD) were undertaken in 2007 for the Metro North project at a DBC site near Ballymun. The work was carried out by Cambridge Insitu Ltd. using a 95 mm diameter Cambridge High Pressure Dilatometer, an instrument which was developed from the earlier design of Hughes [27] to carry out testing in soft to weak rock. The instrument is lowered into a nominal 100 mm pocket, which was made by the Geobore S coring rig. Once in place, the membrane covering the central third of the probe inflates and thus loads the borehole wall. The expansion of the membrane is monitored by sensitive feelers. A significant concern regarding testing in DBC is the rough nature of the borehole walls and the likely presence of gravel and cobble-sized clasts, which might interfere with the expansion of the probe. Full details of the instrument used and the analysis techniques can be found in Hughes and Whittle [28].

    A significant number of multi-channel analysis of surface wave (MASW) seismic tests have been carried out in DBC. Some early tests in the material and the procedures used are outlined by Donohue et al. [29]. Down-hole and cross-hole seismic tests have been carried out at a limited number of sites. These were carried out in boreholes drilled using rotary coring techniques such as Geobore S.

    Data on K0 is available from two sources, namely estimates from in situ cross-hole and down-hole geophysical testing and from analysis of HPD data (Figure 21). Estimates of K0 for the Mater Hospital site were made using the procedure of Ku and Mayne [30] and specifically the equation:

    K0=0.64(VshhVsvh)0.797AGE0.0802Depth0.22 (1)

    where the subscripts to the shear wave velocity Vs mean the directions of propagation and polarisation of the shear waves, and the age of the deposit was assumed to be 15,000 years (though the output is not sensitive to this).

    Figure 21.  Coefficient of in situ stress (K0).

    The values obtained using this method are close to 1.0. Typically, K0 of 1.0 to 1.5 are the values commonly used in design practice, e.g., for embedded retaining walls. The HPD-derived values are high, ranging from 2–2.5 at 5 m depth to about 1.5 at 13 m. The reasons for the difference in the results are not clear. It can be noted that the interpretation of K0 relies on an accurate estimation of in situ horizontal stress. This is tentative at best from HPD test data, simply due to stress relief and probable disturbance to material during drilling of the test pocket.

    Additional oedometer tests, over and above those reported previously, were carried out to determine the swelling/unload/reload coefficient (κ) of DBC. This was shown to be a key input parameter into numerical analyses (see Section 8). The tests were carried out for Geobore S samples from a site in Tallaght in south-west Dublin and from the National Library site in Central Dublin. Results are shown in Figure 22 in the form of the change in void ratio (e) with reducing stress and the percentage swelling that occurs with reducing stress.

    Figure 22.  Swelling tests on DBC.

    It can be seen that a significant increase or "kick" in volumetric swelling strain does not occur in the DBC until the pressure is reduced to about 20 kPa, whereas it occurs at higher effective stresses in the London Clay at Heathrow Terminal 5 at about 50 kPa [31] and for the Lambeth Group in Central London. This indicates that the DBC can sustain larger swelling stress changes before destructuring becomes significant, as compared to London Clay or the Lambeth Beds in the UK.

    The low tendency for the DBC to swell is perhaps consistent with the mineral illite dominating the mineralogy of the deposit [2]. Heave of DBC is not considered in practical basement designs in Dublin. To the author's knowledge, there have been no issues with major swelling or any projects where heave/swelling has been measured. This anecdotal evidence is confirmed by the results of the laboratory tests presented here.

    The results of testing of UBrBC from a site in Clonee, Co Meath are summarised in Table 1. Cable percussion (often called "shell and auger") borehole drilling was undertaken at the base of utility inspection pits around 1.2 m below ground level. These pits included hand shear vane tests. Seventeen unconsolidated undrained (UU) triaxial tests were undertaken on samples obtained from U100 driven sampler tubes.

    Table 1.  Laboratory and field test results for UBrBC at Clonee, Co. Meath.
    Sample depth (m) w (%) γb (kN/m3) cu (kPa), UU tests cu (kPa), hand vanes
    1 to 1.2 7–27 (10*) 20 to 23 (20.5) 22 to 75 (30) 55 to 130 (80)
    *Note: characteristic values shown in parentheses.

     | Show Table
    DownLoad: CSV

    The following observations are noted:

    ● In over half of the UU triaxial tests, the measured undrained shear strength (cu) was less than 40 kPa (i.e., low strength), and it is likely that sample disturbance was a key contributing factor.

    ● The measured weight density (γb) is high and consistent with that reported for many sites in Section 3. The scatter observed in both γb and water content (w) is likely due to the variability of coarse particle content present. Figure 1 of BSI [32] shows a relationship between γb and cu. For γb of 20.5 kN/m3, this would equate to stiff (>75 kPa) to very stiff (>150 kPa) fine-grained soil, much higher than the measured during UU testing.

    ● The cu values measured from hand field shear vane tests was between 55 kPa and 130 kPa. Over a third of these tests had values greater than 130 kPa and are likely to have been affected by the coarse particle content. Overall, the measured cu was, on average, three times higher than from UU triaxial testing. It should be noted that in the author's experience, small hand field shear vane tests are often unrepresentative in DBC due to the high content of coarse particles.

    ● Although these relationships are not presented here, there was no discernible pattern of cu changing with either w or γb.

    ● In the view of the author's sampling of DBC with U100 tubes should be discontinued.

    The data reported for the UU testing above confirms the need for testing on higher-quality samples of the material. Some isotropically consolidated undrained compression triaxial tests (CIU) are shown in Figure 23. The tests were on Geobore S samples of UBkBC from work carried out in association with the redevelopment of the Arnott's department store just off O'Connell St. in Central Dublin and from the Cherrywood sites discussed in Section 3.4. These tests represent a range of strength properties of the material. The data is presented in the form of shear stress [t' = (σa'−σ'r)/2, where σ'a and σ'r are the axial and radial effective stresses, respectively, versus axial strain (εa), pore water pressure versus εa, and the s', t' stress path plot [s' = (σa' + σ'r)/2].

    Figure 23.  Typical isotropically consolidated undrained (CIU) triaxial test result for samples from 7.8 m at Arnott's and 5.85 m at Cherrywood (a) shear stress versus axial strain, (b) pore water pressure versus axial strain, and (c) stress path plot.

    The t' versus εa plot shows the classical dilative/strain hardening pattern of an increasing t' with increasing εa. In the Arnott's test, a peak t' is perhaps achieved at some 12% εa, but in the Cherrywood test, a peak is never achieved. The pore pressure response shows strong dilation after about 1% εa, and negative excess pore water pressures are measured after about 6% εa (indicated by the dashed line on Figure 15b). These values are typical for CIU tests in DBC. It is interesting to note that the mid-plane pore pressure probe gives the same response as the conventional transducer mounted at the sample base. Again, this is a commonly found result. Analysis of the stress paths demonstrates a range of variation in the peak angle of the shearing resistance of the material. The strength of the Cherrywood material is much higher than expected from its index properties.

    The database of CIU test results summarised from Simpson [17] for the UBkBC samples are shown in Figure 24. Figure 24a shows the initial water content of each sample. Values decrease from about 10% at 2 m depth to about 6% at 12 m and are generally somewhat lower than the average value for the UBkBC measured in the DPT project [3].

    Figure 24.  Database of triaxial test results (a) initial water content, (b) cu at peak deviator stress, and (c) cu at axial strain of 2.5%.

    Given the nature of the triaxial test stress-strain curve discussed above, the issue then, of course, is where to choose the undrained shear strength (cu). Values chosen at peak deviator stress are shown in Figure 24b, and values taken at 2.5% axial strain are given in Figure 24c. Choosing cu for εa between 2.5% and 5.0% is often used in practice to ensure that the strains experienced by the relevant engineering structure are limited to acceptable values and to maintain the excess pore pressures developed in the positive zone and avoid any negative values.

    Regardless of the criteria used, the cu values are very high. Many are in excess of the 300 kPa limit corresponding to "hard/extremely high strength" clay, according to [33]. In fact, this standard suggests that material with cu greater than 300 kPa could be classified as soft rock [34]. There is considerable scatter in the data, perhaps not surprisingly given the high content of coarse particles. Further work is recommended to understand what effect the presence of possible fissures have on the soil behaviour. However, there does appear to be some weak tendency for an increase in shear strength with depth. An important finding is that the values derived from unconsolidated undrained (UU) tests are very similar to those from CIU tests. A similar conclusion was made by Long and Menkiti [3] for tests from the DPT project and for work done on the Dublin Central project, off O'Connell St. [35].

    Simpson [17] explored the relationship between cu and a range of index parameters such as water content, liquid limit, plasticity index, and liquidity index, and found the best fit was with the water content. A plot of cu (taken at 2.5% axial strain) against initial water content is shown in Figure 25a. Although there is some scatter, there is a clear tendency for a decrease in cu with increasing water content. It is well known that the behaviour of low plasticity glacial till is sensitive to changes in water content [6]. These findings are consistent with typical industry practice on-site to protect the DBC beneath shall foundations. In Figure 25b, the focus is on the time between field sampling and sub-sampling. Similar to the findings on sample disturbance assessment discussed above, the time to sub-sampling has a considerable influence on cu. Samples that were sub-sampled immediately on recovery in the field have a higher strength, for the same water content, than those sub-sampled later.

    Figure 25.  Undrained shear strength of UBkBC taken at 2.5% axial strain (a) all data and (b) focus on the time between in situ sampling and sub-sampling.

    Some consolidated undrained triaxial tests with shearing in extension have been reported by Menkiti et al. [11] and Long and Menkiti [3]. The results of these tests are summarised in Table 2 and are compared against compression tests carried out on core from the same depth in the same borehole. Significant strength anisotropy was suggested by undrained triaxial extension strengths. For the UBrBC, the UBkBC, and the LBrBC, the average ratio between compression and extension strength is 4.0, 3.9, and 2.0, respectively. These values can be compared, for example, with the work of Lunne et al. [36] on Norwegian clays, who found that the average ratio between cu in compression and extension for anisotropically consolidated triaxial tests on high-quality block samples was of the order of 2.5. Most of the DBC samples failed by forming shallow dipping failure planes (necks), which often engaged pre-existing discontinuities. It seems likely that the high content of coarse particles contributes to the low values measured.

    Table 2.  Summary of CIU tests for anisotropy assessment.
    Test No Depth (m) Unit K0 assumed in consolidation cu (kPa) at peak deviator Anisotropy ratio
    TE-0-1-B-C 0.7 UBrBC 1.5 84 4
    TE-0-1-E-F 1.2 UBrBC 1.5 −21
    DPT15 3.6 UBkBC 1.5 393.5 3.8
    DPT2 4.1 UBkBC 1.5 −103.6
    DPT3 7.5 UBkBC 1.5 −104.3
    DPT4 7.5 UBkBC 1.5 465.9 4.5
    DPT14 3.8 UBkBC 1.5 −86.2
    DPT15 3.6 UBkBC 1.5 393.5 4.6
    TE-6-7-C-D 2.5 UBkBC 1.5 129 2.5
    TE-9-10-C-D 2.5 UBkBC 1.5 −52
    DPT12 11.5 LBrBC 1.5 −136.4
    DPT13 11.5 LBrBC 1 272.6 2.0

     | Show Table
    DownLoad: CSV

    As discussed in Section 5.1, cu can be determined from the empirical relationship proposed by Stroud [20] using the Equation cu = f1( = 5–6)*N. As has been shown in Figures 3d, 6d, 9d, 11d, 14d and 17c many of the N values for DBC were recorded as "refusals" or the test was stopped at 50 blows. This means a maximum cu of 300 kPa is often used in design. Based on the data shown on Figures 24 and 25, this value likely significantly underestimated the true strength of the material, particularly at depths below 4 m to 5 m.

    Long et al. [37] demonstrated that there was a good relationship between undrained shear strength and shear wave velocity for a range of Irish glacial tills. The Vs values were mostly derived from the MASW (multi-channel analysis of surface wave) technique (see Section 5.4). Of the 13 sites included in this database, 9 involved DBC. The Dublin data are shown in Figure 26. Most of the data are for UBkBC, with some LBrBC data from the DPT site. Also shown on the figure is the trendline developed for all the Irish tills and confirms that the approach of using Vs to estimate cu shows some promise, particularly for giving a first estimate of cu for preliminary designs or for checking the results of more detailed testing.

    Figure 26.  Undrained shear strength versus shear wave velocity. Figure modified from that given in Long et al. [37].

    Correlations between Vs and SPT have also been attempted but have proven unsatisfactory due to the high scatter in the data [38].

    It is very likely that the HPD tests undertaken in 2007 were drained events. This is evident from the observation that stiffness increases with increasing stress and also with the knowledge that in some tests the membrane loses contact with the borehole wall (personal communication with Robert Whittle of Cambridge Insitu, January 2025). Therefore, it is not appropriate to attempt to derive cu from these tests.

    Small-strain shear modulus (Gmax) can be obtained directly from shear wave velocity according to the classical formula:

    Gmax=ρV2s (2)

    where Gmax is in Pa, Vs is in m/s, and ρ is the total mass density (in kg/m3).

    Gmax usually involves strains of 10-4 to 10-3 % and less. Gmax values may need to be reduced to give the strain level relevant to a particular problem. This point will be addressed later.

    A large body of Vs measurements for DBC exists (see Figure 27). Most of these tests were derived from MASW testing. Vs values are very high and range from an average of about 300 m/s close to ground level to 900 m/s at 16 m depth. The DBC values are much higher than those of the well-characterised till at Cowden on the east coast of England [39]. It is also interesting to note that, below about 4 m depth, all the Vs values correspond to those of a "hard" soil according to the system suggested by Poulos [40]. This finding is consistent with other test results for the material, such as the limit of 300 kPa as the boundary between soils and rock, according to [41].

    Figure 27.  Vs profiles for DBC. Figure updated from that shown in Long and Menkiti [3].

    Small strain stiffness anisotropy is a key consideration for the design of many underground structures such as embedded retaining walls and foundations for laterally loaded piles. This is of particular concern for heavily overconsolidated clays [42].

    For any type of geophysical test, care is needed in understanding the direction of propagation and polarisation of shear waves. In simple terms, three types of shear waves are possible [43]. Shear waves can have a horizontal travel direction but be either vertically or horizontally polarised (Vs-hv and Vs-hh), or shear waves can be vertically propagating and be horizontally polarised (Vs-vh). For an anisotropic linear elastic soil at low strain, theoretically, Vs-vh should equal Vs-hv. However, due to the effects of fabric, this does not apply to some soils. It is unclear which directions of propagation and polarisation are represented by surface waves (such as in MASW). The techniques will provide a bulk measure of velocity underneath the full spread length. In a layered anisotropic soil, it is possible that the interpreted Vs from surface waves would be a mix of Vs-hv and Vs-vh.

    Some data for the Mater Hospital site are shown in Figure 28. These include both laboratory (from bender elements) and field data, measured using a series of down-hole and cross-hole tests with different hammer arrangements. The differences in the Vs values are very small, indicating that the degree of anisotropy of the material is low. The laboratory values are lower than the field measurements and do not show any increase in stiffness with depth, despite the samples being reconsolidated to the in situ stresses. These findings are likely to be due to some small disturbance effects, a result which is often reported.

    Figure 28.  Vs Stiffness anisotropy Mater Hospital site.

    Similar sets of laboratory data for the Metro North work and for some investigations for the proposed Interconnector/Dublin Area Rapid Travel (DART) underground project (Heuston Statin to Spencer Dock) are shown on Figures 29 and 30, respectively. The former samples were not consolidated, and the latter set of data was on reconsolidated samples. The findings are similar to those from the Mater Hospital, with the degree of anisotropy being low.

    Figure 29.  Stiffness anisotropy Metro North site. RC76 is situated beside Hampstead Avenue, which is just off Ballymun Road. RC75 is situated close to Collins' Avenue/Ballymun Road junction. The two boreholes are approximately 500 m apart as the crow flies.
    Figure 30.  Stiffness anisotropy Interconnectors/DART underground project.

    All these results are summarised in Figure 31. Overall, the anisotropy ratios Vs-hh/Vs-vh and Vs-hv/Vs-vh are 1.12 and 1.15, respectively. These values are lower than those for Cowden till for example [39]. At Cowden, at 10 m for example, the ratios are 1.3 and 1.15, respectively.

    Figure 31.  Stiffness anisotropy summary.

    Values of shear stiffness with strain corresponding to 0.01%, 0.1%, and 1% shear strain, obtained from HPD testing, are shown in Figure 32. The 1% values are close to the 33 MPa value often assumed for elastic stiffness of the DBC under drained conditions (Drained Young's modulus = 80 MPa). These values are a little lower than those obtained from triaxial testing on instrumented samples [2]. It should be noted that the small-strain stiffness values derived from Vs (see Figure 27) are appreciably higher. For example, a Vs of 500 m/s corresponds to a small-strain stiffness Gmax of 575 MPa. Conservative assumptions on the values of G used in retaining wall analysis is one of the reasons that the measured lateral wall movements of retaining walls in DBC are generally relatively modest (see Section 7.1).

    Figure 32.  Variation in shear stiffness with strain.

    Some triaxial test results on the UBkBC and LBrBC from the Central Dublin project at O'Connell St. (site described in Section 3.6) are shown in Figure 33 [35]. Reference is also made to the triaxial test results presented in Figure 23. There is little difference between the results from the two boulder clay units or from the two laboratories where the tests were carried out. The range of peak angle of shearing resistance (ϕ'peak) varies between 32° and 46°.

    Figure 33.  Determination of peak angle of shearing resistance (ϕ'peak) for Central Dublin project at O'Connell St. [35].

    Values of ϕ'peak and large strain critical state angle of shearing resistance (ϕ'cv) derived from HPD tests are compared to the range of values for DBC, determined from triaxial tests outlined by Long and Menkiti [3] in Figure 34. The ϕ'peak values fall within the range previously derived from triaxial testing and also compatible with the data shown in Figure 33. Similarly, the angle (ϕ'cv) is close to those derived from laboratory tests, albeit being slightly lower on average. Effective cohesion (c') is normally assumed to be equal to zero in DBC.

    Figure 34.  Effective stress strength parameters (a) peak angle of shearing resistance (ϕ'peak) and (b) critical state angle of shearing resistance (ϕ'cv).

    The lateral behaviour of embedded retaining walls in DBC is strongly dependent on time after excavation [12,44,45]. Such behaviour is attributed to the dilatant nature of DBC under shear in undrained conditions following unloading. This gives rise to large suctions within the material, which may take considerable time to dissipate due to the low permeability of the soil matrix (k = 1x10⁻⁹ to 1x10⁻¹⁰ m/s). Furthermore, the reported lateral deflections during the lifetime of such retaining walls (typically up to 180 days) are considerably less than worldwide trends in the temporary condition for both cantilever and propped walls with a wide range of system stiffness.

    Ireland's economy has experienced a strong resurgence in the past decade, which, combined with the unprecedented demand for housing, has led to an upsurge in commercial and residential developments in the greater Dublin area. Several projects have utilised single-, double- and, in some cases, triple-level basements retained by embedded contiguous and/or secant pile walls, predominantly to maximise basement space. Most of these walls were constructed using either continuous flight auger (CFA) or rotary bored techniques. Given the history of low wall deflections in DBC, designers are now increasingly adopting the Observational Method (OM) [46] to optimise the design of embedded retaining walls in DBC through detailed monitoring of lateral deflections during excavation and basement construction. The OM seeks to get optimum performance from a retaining structure by exploiting where the actual conditions at a site fit within the range of responses that lie between fully drained and fully undrained behaviour, as is the case for DBC. Detailed monitoring, selection of trigger levels and having contingency measures in place are key components of OM. This is reasonable in DBC, as the actual rate of pore pressure dissipation and equalisation can be very variable, but its effects can be inferred from monitoring during construction. Different approaches are available with the method depending on whether a conservative or optimistic, or "best estimate" design is being implemented [46].

    In this section, the retaining wall databases by Long et al. [12] have been augmented by additional monitoring data for embedded retaining walls installed in DBC since 2010.

    A total of 60 case histories of wall deflections from 18 sites in the greater Dublin area have been collated by the authors since 2010. The majority of records are from the authors' files, which have not been published to date. The resulting databases for propped and cantilever walls are summarised in Tables B and C, respectively, in Appendix B to this paper. In keeping with the original DBC database by [12], the individual case histories include details of wall dimensions, configuration, ground conditions, excavation depth, measured deflections and, where available, time after excavation at which the maximum deflections were reported. Unfortunately, none of the case histories in Tables B and C report vertical settlements on the retained side of excavations.

    Propped walls

    A total of 37 propped walls were monitored across 13 individual sites. The resulting variation in maximum measured deflection δh with retained height H is presented in Figure 35a, while Figure 35b plots normalised deflection δh/H against system stiffness EI/γws4. Here, EI is the wall stiffness, γw is the unit weight of water, and s is the prop spacing. It is apparent that:

    Figure 35.  Behaviour of propped walls. (a) maximum lateral movement plotted against excavation depth and (b) normalised maximum movement plotted against system stiffness—post-2010 database.

    ● δh values for propped walls in DBC continue to remain within the bounds of δh/H = 0.18% reported by Long [47] from 169 world cast histories for embedded retaining walls in clay (due to deflections being 10 mm or less), and significantly less than δh/H = 0.4% recommended by [48]. Crucially, the measured deflections typically correspond to periods of up to 6 months after excavation, demonstrating:

    ● In line with that observed by [12] for the original DBC database, δh/H is independent of EI/γws4. This well-known trend has led to wall designers increasingly adopting a "double soft" secant wall in DBC, whereby pairs of primary piles are installed between secondary reinforced piles to reduce the system stiffness (due to the wider spacing) without sacrificing on wall performance. Such a configuration was not reported in the original DBC database by [12] but accounts for approximately 20% of case histories within the post-2010 database in Table A.

    ● Despite having a low permeability, which impedes groundwater flow, there is a tendency amongst civil/structural engineers to specify secant walls in DBC, possibly due to concerns regarding spalling of soil between contiguous piles. Perched water is common near the surface, both in Made Ground and in the UBrBC. There may be opportunities to explore the use of contiguous piled walls where there is a good understanding of the hydrogeological model.

    Most case histories in Table B pertain to flying shore propping with proprietary hydraulic preloading systems, presumably due to adjacent third-party properties preventing the use of tie-back anchors. Moreover, temporary anchors are utilised in Dublin city centre, and Glass Fibre Reinforced Polymer (GFRP) thread bars are now mandatory, according to Dublin City Council (DCC) to prevent sterilisation of underground space for future development. Up to now, the use of these GFRP anchors has not been extensive due to cost and time considerations with respect to obtaining the appropriate licence. For this reason, and especially if there are buildings on one or two sides of an excavation, flying shore propping remains popular.

    Nonetheless given the reduced stiffness of these GFRP anchors in comparison to traditional steel types, the trends observed in Figure 35 may potentially result in increased wall deflections where GFRP anchors are adopted. As such, publication of case histories of GFRP anchor-supported embedded retaining walls in DBC is encouraged in order to establish whether the lateral deflections of these walls differ to traditional anchored walls reported in Table B and [12].

    Cantilever walls

    Cantilever walls remain the preference when sensitive receptors (i.e., structures and utilities) are absent. The Long et al. [12] database has been augmented by an additional 37 case histories in the greater Dublin Area, including 12 walls with cantilever retained heights ≥ 8 m, suggesting increased confidence amongst designers to adopt cantilever solutions for greater retained heights than previously.

    Figure 36a illustrates the relationship between maximum measured deflection δh and retained height H for the 37 case histories, while the corresponding variation in normalised deflection δh/H against system stiffness EI/yws4 is presented in Figure 36b; also superimposed on these plots are the deflection data from the pre-2010 DBC database by [12] for comparative purposes. The following are noteworthy:

    Figure 36.  Behaviour of cantilever walls. (a) Maximum lateral movement plotted against excavation depth and (b) normalised maximum movement plotted against system stiffness—post-2010 database.

    ● As expected, lateral deflections are proportional to the retained height (Figure 36a), although the maximum recorded deflections are typically less than 10 mm for retaining heights of up to 8 m, highlighting the high strength and stiffness of DBC. Furthermore, the deflections show in excellent agreement with the pre-2010 database, with maximum recorded deflections typically less than 10 mm for retaining heights of up to 8 m. In agreement with the observations of [12], δh/H tends to reduce when EI/γws4 increases (Figure 36b).

    ● The sites with cantilever retained heights ≥ 8 m in Figure 36a show somewhat conflicting behaviour, particularly for the two sites in Cherrywood, south Dublin. For Site A, there is a tendency for deflections to reduce with increasing retained height; inspection of the wall layout indicated a combination of corner effects and restraint from the capping beam may have contributed to the wall stiffness, resulting in enhanced resistance to deflection. Time-dependent wall deflection behaviour was evident for several wall piles at Site B, which was attributed to the reduced fixity of this wall below excavation level due to depth limitations of the piling rig, as well as a thicker stratum of reworked made ground on the retained side of the wall. Nonetheless, deflections were monitored at frequent intervals over the course of the works, with values remaining within limits for the 6-month construction period.

    ● Most of the case histories exhibited strongly time-dependent behaviour, as highlighted in previous studies by [45]. Such behaviour is difficult to capture within Figure 36 due to the variable construction periods.

    ● Contiguous walls account for 20 of the 37 case histories in Table C, which suggests that engineers are increasingly confident in adopting this configuration as a retention solution where sensitive structures are absent. For retained heights over 8 m, pile spacings equivalent to 1.25 D (where D is the pile diameter) or greater are being utilised for cantilever walls in DBC due to (ⅰ) the positional and verticality tolerance requirements, particularly as these piles must have sufficient embedment below dredge level for fixity, and (ⅱ) the increased stand-up time exhibited by the high strength and low-permeability of DBC minimises the risk of spalling, thus enabling a large gap between adjacent piles.

    In summary, propped and embedded retaining walls in DBC continue to exhibit reduced deflections in comparison to other stiff clay case histories in the literature, with the time-dependent behaviour providing engineers with opportunities to optimise both configuration and retained heights for basement construction in the greater Dublin area. DCC have recently introduced the requirement for a Basement Impact Assessment (BIA) as part of planning, which includes the requirement to assess the effects of ground movement on sensitive receptors in the zone of influence of the wall. This requires further research to capture the vertical settlement behaviour, an aspect that tends to be ignored for basement excavations within the environs where DBC is present.

    Menkiti and Long [49] and Menkiti et al. [50] reported on their experience with soil nailing on the DPT cut and cover project. This involved 10 m to 12 m deep excavations cut near vertical (at 75° inclination). Moreover, maximum horizontal movement was 12 mm to 15 mm for a fully nailed slope constructed with good workmanship (i.e., without excessive air pressures during drilling). This is equivalent to 0.12% to 0.13% H. Very high ultimate skin friction between the nails and the DBC were developed. These varied between about 200 kPa and 550 kPa with an average of some 400 kPa.

    Odega [51] reported on some testing of single-bore multiple anchors (SBMA) in high-strength (hard) UBkBC. The anchors were of the type described by Barley [52] and were installed at an industrial site in the Dublin Docklands area. Some details of the site are shown in Figure 37a. The DBC was of very high strength at the site.

    Figure 37.  SBMA test results in UBkBC. (a) site details and SPT test results, and (b) bond stresses developed.

    Three trial anchors (TA1, TA2 and TA3) were installed, and some typical results for TA1 are shown in Figure 37b. The tendons had free lengths between 24 m and 31.5 m, and each had a bond length of 2.5 m. The bore diameter was 220 mm. The bond stresses shown in the image were calculated by simply assuming an equal distribution of stress along the bond length. The tendons/anchors behaved very well with a linear stress/displacement pattern being observed up to the applied stress of 304 kPa and indicate that the ultimate stress was not fully mobilised. The calculated elastic extension for Tendons 1 and 4 is shown for illustration.

    The results of the soil nail work and the trial SMBA anchors show that the DBC can sustain very high shear stresses, much higher than those assumed in design. Similar findings were made for the back-analysis of piles in DBC by Gavin et al. [53] and Lawler and Farrell [54]. It would seem there is scope for enabling high shear stresses to be used in the design of such systems.

    Given the low permeability of the UBkBC, it could be expected that the development of long-term movements would be very slow, over many years. A well-documented case history for Shaft WA2 on the DPT project is presented by Menkiti and Long [55], where the very opposite occurred. At this location, about 31 m of DBC overlies limestone bedrock, with the bedrock being dewatered to facilitate construction. Dewatering commenced during a significant pause in construction, enabling consolidation settlements, directly linked to pore pressure changes in the clay, to be examined. At the site, lenses of coarse material were present in the DBC. It had been thought that the granular lenses were occluded within the clay till or interconnected into a horizontal drainage horizon (Figure 38a).

    Figure 38.  (a) Originally interpreted ground conditions at WA2 site and (b) those inferred from observed in situ behaviour. Figure modified from Menkiti and Long [55].

    However, carefully interpreted data by Menkiti and Long [55] of the Shaft WA2 case history demonstrated the existence of a 3-D network of granular zones that were hydraulically interconnected to each other and to the limestone bedrock (Figure 29b). It seems that the local subglacial drainage system at the time of till deposition was a distributed network of linked cavities or braided canals, which is reflected in the distribution of the granular zones [56]. Groundwater drawdown in the limestone at Shaft WA2 effectively mobilised these connections and resulted in short drainage paths and rapid drainage of the clayey DBC, despite the low permeability of the clayey facies (Figure 38b). Back-calculations by Menkiti and Long [55], based on the average observed consolidation settlement and the thickness of the DBC, gave a mass coefficient of volume compressibility, mv = 0.0016 MPa-1, and an average vertical strain of 0.02%. Assuming a Poisson's ratio v' = 0.2, a vertical Young's Modulus of 553MPa was also implied, which is generally consistent with stiffness degradation curves back-analysed from horizontal movements of cut slopes and shafts in DBC [11,57] (see Section 6.5).

    It is concluded that long-term ground movements in DBC can be rapid or very slow, depending on small details of the local geology, and attention should be given to such details at ground investigation and design stages.

    Monitored response to TBM tunnelling a little to the north of Shaft WA2 on the DPT project (see Figure 1) is shown in Figure 39. Immediate centreline settlement due to passage of the open face TBM used is shown in Figure 39a. The 11.77 m excavated diameter tunnel was bored with a relatively shallow cover of 10.9m above the tunnel crown, resulting in immediate settlement of about 40mm, consistent with a volume loss of 0.72%, with an additional 4mm time-dependent settlement developing over 10 months. Passage of the second tunnel generated a similar immediate centreline settlement with additional time-dependent settlement of about 3 mm developing over 1 year (Figure 39).

    Figure 39.  (a) Settlement above DPT tunnels in boulder clay at Ch 2 + 120 m, 95 m north of Shaft WA2 (see Figure 1), illustrating immediate and time-delayed tunnelling-induced settlement above the southbound tunnel crown, and (b) settlement profiles at the same chainage (tunnel excavated diameter = 11.77 m, tunnel centreline depth = 16.8 m).

    During excavation works for the Dublin Port Tunnel project, it was observed that the DBC did not always present as a homogenous intact material, but could contain intense fissuring on occasions, which enabled the material to break off into "blocks" on excavation and drilling. Two examples of this are shown in Figure 40 below.

    Figure 40.  Failure of excavated surface in DBC due to intense fissuring. (a) top, slabbing during excavation and soil nailing of lift 1 at Ch 1260-1240E, and (b) bottom, breakage into cuboids during excavation at lift 2 of Ch Ch1400 East.

    The failed blocks were generally small (<2 m3), breaking into slabs (Figure 40a) or cuboids (Figure 40ba). Very difficult construction conditions resulted, where such fissures were unexpectedly encountered during soil nailing, just below the made ground and during heavy rain. The fissures, which are normally closed and tight, opened, generating slab-like failures, with the opened fissures charged by groundwater from unknown disused drains in the made ground. Mitigation measures that were successfully applied included flash shotcreting with a high accelerator dose, supporting the slope with a granular berm, improved drainage, and more robust soil nailing, drilled using muted air pressures.

    A review showed that intense fissuring was observed in less than 1% of the total logged faces for the DPT project cut and cover works (amounting to a logged surface area of about 27,900 m2).

    A summary of the input parameters used in the various attempts to model DBC in finite element analyses is given in Table D of this paper. Early work on the topic made use of the Mohr-Coulomb model [44]. Some numerical modeling of the DBC using the Hardening Soil Model (HSM) in the computer software PLAXIS under drained conditions has been reported by Lawler et al [54]. Lehane and Simpson [14] reported on the use of the BRICK soil model to capture the behaviour of DBC in triaxial testing, and they show that when implemented into a finite element code, the model can produce realistic predictions of the settlement of shallow footings.

    Perhaps the most comprehensive non-linear, full-coupled numerical analysis of DBC has been performed by Kovacevic et al. [58] and [59]. These two papers deal with a 7.5 m high contiguous piled cantilever wall at Ballycullen Road and a 14 m high propped secant pile wall at Heuston/Westgate 14 m, respectively, the details of which had been previously reported by O'Leary et al. [45]. DBC was characterised by a form of the Modified Cam-Clay model. Model parameters were derived from an extensive set of data, including the swelling tests described in Section 6.2. The measured wall movements were well produced. The analyses give insight into the competing mechanisms at play and provide additional confidence in the design and use of relatively high cantilever walls in DBC. The work successfully predicted trends to failure and gave proof of necessity for significant remedial works in the Heuston case. Recently, Pedro et al. [60] carried out some numerical modelling of Shaft WA2 to examine novel methods of shaft construction to facilitate savings in CO2.

    With basement impact assessments now required by DCC at the planning stage, more use of finite element modelling for assessing movements is likely to be required in the future. Tight settlement criteria for excavations near important infrastructures, such as railway lines, require the use of non-linear constitutive models to demonstrate compliance. The strong tendency for DBC to dilate during shearing is difficult to capture in commercially-available constitute models, and further work is required in this regard.

    We present a comprehensive summary of the geotechnical characterisation and properties of the DBC, arguably the most important geotechnical material in Ireland from an economic point of view. The work expands on previous research from about 20 years ago. Some of the major conclusions made are:

    ● Although the units within the DBC are well understood, their presence is not always consistent across the area, and the need for a comprehensive ground investigation is clear, especially for projects involving deep excavations or heavy loads.

    ● Detailed stratigraphical records combined with simple index testing are sufficient to characterise the different units of DBC. Even on more routine projects, a small number of Geobore S core holes, to complement cable percussive work, can be very valuable.

    ● Geobore S rotary cored sampling of the material is now commonplace. Combined with sub-sampling, it will provide good quality cores for strength and stiffness testing. Sampling of the material using open drive U100 tubes should be discontinued.

    ● The time taken to sub-sample has a considerable influence on strength. Samples that were sub-sampled immediately on recovery in the field have a higher strength for the same water content than those sub-sampled later. Further studies are required to understand the cause, e.g., by measurement of soil suction and how this dissipates with time.

    ● CPT and SPT testing of the material is problematic due largely to the high content of coarse particles. SPT can be a useful index test, particularly in the upper deposits. Some SPT testing, e.g., at the end of a Geobore S core run, can be useful in case there is no suitable core for testing.

    ● Geophysical shear wave velocity measurements appear very useful. There also appears to be some promise in high-pressure dilatometer testing (HPD) though further work is required in this topic.

    ● The lower units of DBC (i.e., material below the UBrBC) exhibit classical dilative/strain hardening shearing behaviour under CIU. These materials are very strong and stiff and appear to have higher strength and stiffness values than other glacial tills. These properties do, however, show some variability across sites and the area. The degree of anisotropy of stiffness is low.

    ● UBkBC is typically a low plasticity clay that is susceptible to reduction in strength with small changes in water content.

    ● Further use of CIU triaxial testing on the Geobore S cores is strongly encouraged.

    ● The material behaves very well in open cuts, and supports deep excavations, above tunnels, and in ground anchors and soil nails. However, some examples have been given where settlements have occurred more rapidly than expected and where intense fissuring of the material can cause issues in open cuts.

    ● There is scope for more efficient design of retaining structures, e.g., using fewer stiff structures (e.g., "double soft" secant walls) and cantilever retaining walls where there is no important infrastructure behind the wall.

    ● It is recommended that vertical displacement measurements behind the back of embedded retaining walls are undertaken to assist designers in undertaking ground movement assessments (as now required by DCC) on adjacent sensitive buildings or infrastructure in the zone of influence of the wall.

    ● Very high shear stress can be developed between geotechnical structures (e.g., soils nails, anchors, and piles), and it would seem there is scope for using higher values in design than are used at present.

    ● Some numerical modelling of the material has been carried out. However, it is felt that further work is required in this regard, especially given an increasing requirement for ground movement assessments to be made at the planning stage of projects.

    All of the authors have contributed widely to the paper but, given the breath of the material, each author focused mainly on particular areas. M. Friedman was mainly responsible for the work in St. Stephens Green. R. Travers focused on the work done in Montrose, Cherrywood and Greencastle and on the sampling and sub-sampling processes. D. Gill focused on the work done in Cherrywood and Central Dublin. K. Simpson performed the work done on undrained shear strength and sample disturbance assessment. K. Flynn was responsible for the sections on retaining walls. C. Menkiti was the main author of the sections on swelling, soil nailing and unexpected behaviour of the material. M. Long collated all the sections, drafted the paper, prepared the figures and focused on the work on in situ geophysical and HPD testing

    The authors declare they have not used Artificial Intelligence (AI) tools in the creation of this article.

    Many of the colleagues of the authors have contributed to the work present. In particular the authors are grateful to Maurice Ryan of P.J. Edwards (formerly Byrne Looby) for assisting with retaining wall data and to Frank O'Leary, formerly a PhD student at UCD for some of the laboratory tests reported. Robert Whittle of Cambridge Insitu Ltd provided valuable advice on the results of the HPD testing.

    The authors are not aware of any conflict of interest pertaining to the information presented in this article.

    Table A.  Statistical analysis of index test data. NB values given are: average/standard deviation (number of data points).
    Site UBrBC w (%) ρ (Mg/m3) Ip (%) UBkBC w (%) ρ (Mg/m3) Ip (%)
    St. Stephens Green west 18.73/4.65 (4) 17.75/2.87 (4) 13.37/5.65 (22) 2.206/0.152 (5) 16.8/7.32 (15)
    St. Stephens Green east 10.55/2.97 (13) 2.273/0.049 (4) 14.67/1.94 (9)
    Montrose 13.18/1.95 (34) 13.71/2.36 (34) 9.94/1.87 (23) 2.404/0.023 (13) 14.18/1.05 (23)
    Cherrywood 9.20/1.98 (29) 2.372/0.05 (15) 9.09/2.16 (16)
    Grangecastle 16.32/6.4 (86) 18.06/4.90 (18) 14.13/3.93 (43) 14.62/4.13 (13)
    Dublin Central project 8.91/2.65 (7) 2.272/0.12 (3) 27.59/13.72 (2)

     | Show Table
    DownLoad: CSV
    Table B.  Post-2010 propped retaining wall database.
    Location Pile Ref Soil at dredge level Soil strength, su (kPa) H (m) h (m) B (m)
    Cherrywood CP199 DBC N = 50+, su > 300 kPa 9.4 0 100
    CP215 DBC N = 50+, su > 300 kPa 14.2 0 100
    Fenian St P20 MG, Soft silt, DBC DBC N = 10-100 10.2 6.3 17
    P68 MG, Soft silt, DBC DBC N = 10-100 7.5 6.3 17
    P118 MG, Soft silt, DBC DBC N = 10-100 8.8 6.3 47
    Adelaide Rd P122 DBC, Limestone N = 25-100 8.4 4.1 35
    P133 DBC, Limestone N = 25-100 8.4 4.1 35
    Hansfield P45 DBC, Limestone N = 20-50 5.4 0.0 10
    Baggot St, Site A P24 DBC, Gravels, Limestone N = 12-50 7.6 2.0 24
    P40 DBC, Gravels, Limestone N = 12-50 7.6 2.0 24
    P89 DBC, Gravels, Limestone N = 12-50 8.7 5.0 53
    P135 DBC, Gravels, Limestone N = 12-50 8.7 5.0 24
    P161 DBC, Gravels, Limestone N = 12-50 8.7 5.0 24
    P203 DBC, Gravels, Limestone N = 12-50 7.6 2.0 53
    Chatham St P70 MG, DBC, Limestone N = 30-100 5.0 4.0 13
    P172 MG, DBC, Limestone N = 30-100 6.6 4.0 13
    Earlsfort Terrace ? MG, DBC, Limestone N = 14-100 8.3 ? ?
    Ballsbridge ? Gravels, DBC, Limestone ? 7.9 ? ?
    Lad Lane ? DBC, Limestone ? 7.4 ? ?
    National Gallery ? DBC ? 3.6 ? ?
    Burlington Rd ? DBC ? 7.6 ? ?
    Baggot St, Site B ? DBC, Gravels, Limestone ? 8.4 ? ?
    Canada House ? DBC, Gravels ? 8.6 ? ?
    Support Configuration s (m) Wall type Pile dia/spacing/ length (m) EI (kN/m2) δh (mm) System stiffness EI/γws4 δh/H (%) Time after excavation (days) Reference
    Single anchor 2.2 Contiguous 0.9 / 1.15 / 14.3 840,163 5.2 3656 0.055 189 AGL/BPF files
    Single anchor 2.2 Contiguous 0.9 / 1.15 / 17.1 840,163 5.6 3656 0.040 189 AGL/BPF files
    Single prop 6.0 Secant trad 0.6 / 1.0 / 14.5 190,852 10.1 15 0.099 36 AGL/BPF files
    Single prop 6.0 Secant trad 0.6 / 1.0 / 10.5 190,852 3.5 15 0.047 36 AGL/BPF files
    Single prop 6.0 Secant trad 0.6 / 1.0 / 11.2 190,852 2.6 15 0.03 36 AGL/BPF files
    Raking prop 4.7 Contiguous 0.6 / 0.75 / 11 254,469 1.4 55.5 0.017 ? AGL/BPF files
    Raking prop 4.7 Contiguous 0.6 / 0.75 / 11 254,469 0.8 55.5 0.010 ? AGL/BPF files
    Single ring beam 5.0 Secant trad 0.9 / 1.0 / 8.2 190,852 0.3 31.1 0.006 ? AGL/BPF files
    Single prop 8.1 Secant trad 0.9 / 1.4 / 10.4 685,239 4.0 16.6 0.053 148 AGL/BPF files
    Single prop 9.4 Secant double 0.9 / 2.1 / 9.3 456,826 3.6 6.1 0.047 175 AGL/BPF files
    Single prop 4.7 Secant double 0.9 / 2.1 /12.8 456,826 2.0 98.8 0.023 182 AGL/BPF files
    Single prop 4.7 Secant double 0.9 / 2.1 /13.5 456,826 5.4 97.9 0.062 175 AGL/BPF files
    Single prop 8.4 Secant double 0.9 / 2.1 /12.7 456,826 5.0 9.4 0.057 148 AGL/BPF files
    Single prop 8.7 Secant double 0.9 / 2.1 /10.2 456,826 1.0 8.2 0.013 134 AGL/BPF files
    Single prop 6.0 Secant trad 0.6 / 1.0 /8.5 190,852 1.4 15 0.028 106 AGL/BPF files
    Single prop 6.0 Secant trad 0.6 / 1.0 /8.8 190,852 1.9 15 0.029 96 AGL/BPF files
    Single prop 6.0 Secant trad 0.64 / 1.3 /? 190,050 5.5 14.9 0.067 ? BLP files
    Single anchor 2.2 Secant trad 0.6 / 1.1 /? 173,502 10.4 755 0.131 ? BLP files
    Single prop 6.0 Secant trad 0.6 / 1.1 /? 173,502 6.3 13.6 0.085 ? BLP files
    Single anchor 3.9 Secant trad 0.6 / 1.1 /? 173,502 4.8 76.4 0.135 ? BLP files
    Single prop 2.3 Secant trad 0.64 / 1.3 /? 190,050 5.7 692.3 0.075 ? BLP files
    Single prop 6.0 Secant trad 0.64 / 1.15 /? 214,839 3.5 16.9 0.042 ? BLP files
    Single prop 8.0 Secant trad 0.9 / 1.54 /? 627,394 7.4 15.6 0.087 ? BLP files

     | Show Table
    DownLoad: CSV
    Table C.  Post-2010 cantilever retaining wall database.
    Location Pile Ref Soil at dredge level Soil strength, su (kPa) H (m) h (m) B (m)
    Cherrywood, Site A CP18 DBC N = 50+, su > 300 kPa 5.7 0 100
    CP41 DBC N = 50+, su > 300 kPa 6.2 0 100
    CP78 DBC N = 50+, su > 300 kPa 7.0 0 100
    CP106 DBC N = 50+, su > 300 kPa 8.5 0 100
    CP124 DBC N = 50+, su > 300 kPa 8.7 0 100
    CP146 DBC N = 50+, su > 300 kPa 8.7 0 100
    CP181 DBC N = 50+, su > 300 kPa 9.4 0 100
    Cherrywood, Site B M01 MG, DBC N = 20-100 4.4 3 100
    M03 MG, DBC N = 20-100 8.4 3 100
    M04 MG, DBC N = 20-100 8.4 3 100
    M05 MG, DBC N = 20-100 8.4 3 100
    M06 MG, DBC N = 20-100 8.4 3 100
    M07 MG, DBC N = 20-100 8.4 3 100
    M08 MG, DBC N = 20-100 8.4 3 100
    M08A MG, DBC N = 20-100 8.4 3 100
    P19 MG, DBC N = 50+, su > 300 kPa 6.0 2 100
    P23 MG, DBC N = 50+, su > 300 kPa 6.0 2 100
    P48 MG, DBC N = 50+, su > 300 kPa 6.9 3 100
    P64 MG, DBC N = 50+, su > 300 kPa 6.9 3 100
    Dominick St P07 DBC N = 20-100 6.7 4 25
    P35 DBC N = 20-100 4.2 4 25
    P49 DBC N = 20-100 5.4 4 25
    P57 DBC N = 20-100 5.4 4 25
    P79 DBC N = 20-100 5.8 4 25
    P101 DBC N = 20-100 5.8 4 65
    P113 DBC N = 20-100 5.8 4 65
    P139 DBC N = 20-100 5.7 4 25
    P151 DBC N = 20-100 5.7 4 25
    Adelaide Rd P26 DBC, Limestone N = 25-100 5.9 2 35
    Stillorgan P86 DBC, Granite N = 10-50+ 6.0 2 85
    P217 DBC, Granite N = 10-50+ 8.0 0 90
    Deansgrange P370 Soft silt, DBC, Granite N = 10-50+ 4.9 4 50
    P397 Soft silt, DBC, Granite N = 10-50+ 4.9 4 50
    Earlsfort Terrace ? MG, DBC, Limestone N = 14-100 8.0 ? ?
    ? MG, DBC, Limestone N = 14-100 4.2 ? ?
    Windmill Lane ? MG, Gravels, DBC N = 6-50+ 3.7 ? ?
    Lad Lane ? MG, Gravels, DBC N = 30-100 3.9 ? ?
    s (m) Wall type Pile dia/spacing/ length (m) EI (kN/m2) δh (mm) System stiffness EI/γws4 δh/H (%) Time after excavation (days) Reference
    8.0 Contiguous 0.9 / 1.15 / 12.4 840,163 7.4 21.1 0.013 60 AGL/BPF files
    8.7 Contiguous 0.9 / 1.15 / 13.3 840,163 8.5 15.1 0.0137 78 AGL/BPF files
    9.8 Contiguous 0.9 / 1.15 / 15.4 840,163 8.2 9.3 0.0117 96 AGL/BPF files
    11.9 Contiguous 0.9 / 1.15 / 16.4 840,163 7.1 4.3 0.084 85 AGL/BPF files
    12.2 Contiguous 0.9 / 1.15 / 16.4 840,163 2.8 3.8 0.032 78 AGL/BPF files
    12.2 Contiguous 0.9 / 1.15 / 16.4 840,163 3.5 3.8 0.040 47 AGL/BPF files
    13.1 Contiguous 0.9 / 1.15 / 16.9 840,163 5.2 2.9 0.055 111 AGL/BPF files
    6.2 Contiguous 0.6 / 0.775 / 13.1 246,260 8.2 17.4 0.186 134 AGL/BPF files
    11.8 Contiguous 0.9 / 1.15 / 14.1 840,163 9.0 4.5 0.107 134 AGL/BPF files
    11.8 Contiguous 0.9 / 1.15 / 14.1 840,163 10.9 4.5 0.129 134 AGL/BPF files
    11.8 Contiguous 0.9 / 1.15 / 14.1 840,163 17.7 4.5 0.210 134 AGL/BPF files
    11.8 Contiguous 0.9 / 1.15 / 14.1 840,163 24.9 4.5 0.296 134 AGL/BPF files
    11.8 Contiguous 0.9 / 1.15 / 14.1 840,163 13.2 4.5 0.157 134 AGL/BPF files
    11.8 Contiguous 0.9 / 1.15 / 14.1 840,163 6.6 4.5 0.078 113 AGL/BPF files
    11.8 Contiguous 0.9 / 1.15 / 14.1 840,163 18.1 4.5 0.215 113 AGL/BPF files
    8.4 Contiguous 0.9 / 1.15 / 14.1 840,163 4.8 17.2 0.080 179 AGL/BPF files
    8.4 Contiguous 0.9 / 1.15 / 14.1 840,163 2.5 17.2 0.042 42 AGL/BPF files
    9.7 Contiguous 0.6 / 0.775 / 13.3 246,260 11.3 2.9 0.164 98 AGL/BPF files
    9.7 Contiguous 0.6 / 0.775 / 13.3 246,260 10.6 2.9 0.154 15 AGL/BPF files
    9.4 Secant trad 0.9 / 1.6 / 13.8 603,867 4.4 8.0 0.066 85 AGL/BPF files
    5.9 Secant trad 0.9 / 1.6 / 10.0 603,867 3.4 50.3 0.080 85 AGL/BPF files
    7.6 Secant trad 0.9 / 1.6 / 12.1 603,867 5.6 18.5 0.103 71 AGL/BPF files
    7.6 Secant trad 0.9 / 1.6 / 12.2 603,867 5.0 18.5 0.092 71 AGL/BPF files
    8.2 Secant trad 0.9 / 1.6 / 13.6 603,867 4.4 13.9 0.076 71 AGL/BPF files
    8.2 Secant trad 0.9 / 1.6 / 13.8 603,867 3.4 13.9 0.058 71 AGL/BPF files
    8.2 Secant trad 0.9 / 1.6 / 13.6 603,867 5.6 13.9 0.096 78 AGL/BPF files
    8.0 Secant trad 0.9 / 1.6 / 10.8 603,867 5.0 15.2 0.088 64 AGL/BPF files
    8.0 Secant trad 0.9 / 1.6 / 10.8 603,867 1.1 15.2 0.018 64 AGL/BPF files
    8.3 Contiguous 0.9 / 1.05 / 13.4 920,178 3.6 19.8 0.061 104 AGL/BPF files
    8.4 Secant double 0.9 / 2.1 / 8.5 456,826 2.6 9.4 0.043 124 AGL/BPF files
    11.2 Secant trad 0.9 / 1.4 / 11.5 685,239 5.5 4.4 0.069 110 AGL/BPF files
    6.8 Secant double 0.9 / 2.1 / 9.5 456,826 3.8 21.9 0.078 109 AGL/BPF files
    6.8 Secant double 0.9 / 2.1 / 13.8 456,826 4.1 21.9 0.085 109 AGL/BPF files
    11.1 Secant trad 0.64 / 1.3 /? 190,050 16.3 1.3 0.204 ? BLP files
    5.9 Secant trad 0.64 /1.3 /? 190,050 7.8 16.3 0.087 ? BLP files
    5.2 Secant trad 0.6 / 1.1 /? 173,502 3.2 25.2 0.087 ? BLP files
    5.4 Secant trad 0.6 / 1.1 /? 173,502 4.8 20.3 0.123 ? BLP files

     | Show Table
    DownLoad: CSV
    Table D.  Summary of DBC parameters used in numerical modelling.
    Parameter Mohr-Columb (MC) Looby and Long [44] BRICK Lehane and Simpson [14] Modified Cam-Clay (MCC) Kovacevic et al. [58,59] Hardening Soil Small Strain (HSS) Lawler et al. [54] IC MAGE M06 MCC Pedro et al. [60]
    Bulk unit weight, γb (kN/m3) 22.5 21.5 22.5 23.0 22.5
    Yield stress, σ'vy (kPa) - 1300 - 1500 -
    Overconsolidation ratio, OCR - - 7 to15 - 10
    Apparent effective cohesion, c' (kPa) 0 0 0 0 0
    Effective angle of shearing resistance, ϕ'p (o) 35 to 39 31 to 45 35 40 36
    Poisson's ratio υ 0.2 0.2 0.2 0.2
    Specific volume at unit stress, υ1 - - 1.565 - 1.480
    Coefficient of earth pressure at rest, K0 1.0 to 1.3 - 1.5 1.5 1.5
    Coefficient of permeability, k (m/s) - - 10-9 10-9 to 10-11 10-9
    Slope of virgin compression line, λ / λ* - - / 0.03 0.03 / - - 0.03 / -
    Slope of swelling line, κ / κ* - - / 0.006 0.005 / - - 0.002 / -
    Drained Young's modulus, E' (MPa) - - - -
    λ* = λ/(1+e), where e = void ratio
    κ * = κ /(1+e)

     | Show Table
    DownLoad: CSV


    [1] Farrell E, Wall D (1990) Soils of Dublin. Trans Inst Eng Irel 115: 78–97.
    [2] Long M, Menkiti CO (2007) Characterisation and engineering properties of Dublin Boulder clay, Proceedings 2nd International Workshop on Characterisation and Engineering Properties of Natural Soils, 2003–2045.
    [3] Long M, Menkiti CO (2007) Geotechnical properties of Dublin Boulder Clay. Géotechnique 57: 595–611. https://doi.org/10.1680/geot.2007.57.7.595 doi: 10.1680/geot.2007.57.7.595
    [4] Marchant TR, Sevastopulo GD (1980) The Calp of the Dublin district. J Earth Sci 3: 195–203.
    [5] Skipper J, Follett B, Menkiti C, et al. (2005) The engineering geology and characterisation of Dublin Boulder Clay. Q J Eng Geol Hydrogeol 38: 171–187. https://doi.org/10.1144/1470-9236/04-038 doi: 10.1144/1470-9236/04-038
    [6] Clarke BG (2018) The engineering properties of glacial tills. Geotech Res 5: 262–277. https://doi.org/10.1680/jgere.18.00020 doi: 10.1680/jgere.18.00020
    [7] Farrington A (1929) The pre-glacial topography of the Liffey basin. Proc R Ir Acad, Sect B: Biol Geol Chem Sci 38: 148–170.
    [8] Naylor D (1965) Pleistocene and Post Pleistocene sediments in Dublin Bay. Sci Proc R Dublin Soc 2A: 175–188.
    [9] Kealy S, Long M, Fleming M, et al. (2021) Characterisation of gravel deposits in the pre-glacial channel Central Dublin. Ir J Earth Sci 39: 71–88.
    [10] Farrell ER, Coxon P, Doff D, et al. (1995) The genesis of the brown boulder clay of Dublin. Q J Eng Geol 28:143–152. https://doi.org/10.1144/GSL.QJEGH.1995.028.P2.05 doi: 10.1144/GSL.QJEGH.1995.028.P2.05
    [11] Menkiti CO, Long M, Kovacevic N, et al. (2004) Trial excavation for cut and cover tunnel construction in glacial till—a case study from Dublin, Advances in Geotechnical Engineering: Skempton Memorial Conference, Royal Geographical Society, London, March: Thomas Telford, 1090–1104.
    [12] Long M, Brangan C, Menkiti C, et al. (2012) Retaining walls in Dublin Boulder Clay, Ireland. Inst Civ Eng J Geotech Eng 165: 247–266. https://doi.org/10.1680/geng.9.00091 doi: 10.1680/geng.9.00091
    [13] Boulton GS, Paul MA (1976) The influence of genetic processes on some geotechnical properties of glacial tills. Q J Eng Geol Hydrogeol 9: 159–194. https://doi.org/10.1144/GSL.QJEG.1976.009.03.03 doi: 10.1144/GSL.QJEG.1976.009.03.03
    [14] Lehane BM, Simpson B (2000) Modelling glacial till under trixial conditions using a BRICK soil model. Can Geotech J 37: 1078–1088. https://doi.org/10.1139/t00-032 doi: 10.1139/t00-032
    [15] ENISO (2006) EN ISO 22475-1: Geotechnical investigation and testing—Sampling methods and groundwater measurements—Part 1: Technical principles for execution. Geneva: ISO/CEN.
    [16] Clayton CRI, Matthews MC, Simons NE (1995) Site Investigation, 2nd. Edition Oxford, UK, Blackwell Science.
    [17] Simpson K (2020) Advanced investigation techniques for Dublin Boulder Clay. School of CivIl Engineering, UniversIty CollEge Dublin (UCD). ME thesis.
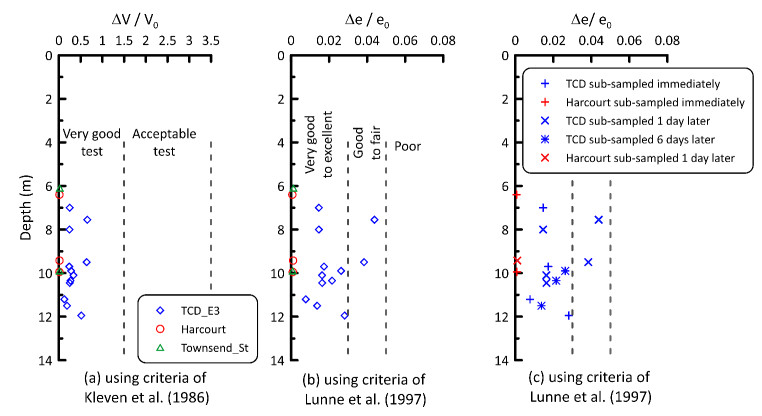
    [18] Kleven A, Lacasse S, Andersen KH (1986) Foundation engineering criteria for gravity platforms. Soil Parameters for Offshore Foundation Design, Part Ⅱ, Norwegian Geotechnical Institute Report 40013-34.
    [19] Lunne T, Berre T, Strandvik S (1997) Sample disturbance in soft low plasticity Norwegian clay, Symposium on Recent Developments in Soil and Pavement Mechanics, Rio de Janeiro: Balkema, Rotterdam, 81–92.
    [20] Stroud MA (1988) The standard penetration test: its application and interpretation, Conference on Penetration Testing in the UK, Londres, 29–51.
    [21] White F, Ingram P, Nicholson DP, et al. (2019) An update of the SPT-cu relationship proposed by M. Stroud in 1974, Proceedings of the XVII European conference of soil mechanics geotechnical engineering, Reykjavik.
    [22] O'Kelly B (2014) CPT testing in Dublin Boulder Clay, International Symposium on Cone Penetration Testing (CPT'14), Las Vegas, Nevada, USA, 761–768.
    [23] Faulkner A, Lehane BM, Farrell ER (1998) Cone penetration testing in Irish soils, 1st International Conference on Geotechnical Site Characterisation (ISC 1), Atlanta, Georgia, USA: Balkema, Rotterdam, 1033–1038.
    [24] Sivakumar V, O'Kelly BC, Madhav MR, et al. (2013) Granular anchors under vertical loading—axial pull. Can Geotech J 50: 123–132. https://doi.org/10.1139/cgj-2012-0203 doi: 10.1139/cgj-2012-0203
    [25] Wu M, Zhao Z, Cai G (2024) Improving the interpretation of undrained shear strength from piezocone penetration tests by integrating soil physical properties using a hybrid meta-heuristic algorithm. J Rock Mech Geotech Eng. https://doi.org/10.1016/j.jrmge.2024.05.057. In Press.
    [26] Zhao Z, Duan W, Cai G, et al. (2025) Robust geotechnical design of piles incorporating system reliability. J Geotech Geoenviron Eng 151. https://doi.org/10.1061/JGGEFK.GTENG-12936 doi: 10.1061/JGGEFK.GTENG-12936
    [27] Hughes JMO (1973) An instrument for in situ measurement in soft clays. University of Cambridge. PhD Thesis.
    [28] Hughes JMO, Whittle R (2022) High Resolution Pressuremeters and Geotechnical Engineering, CRC Press. https://doi.org/10.1201/9781003200680
    [29] Donohue S, Gavin K, Long M, et al. (2003) Gmax from multichannel analysis of surface waves for Dublin Boulder Clay, Proceedings XⅢth European Conference on Soil Mechanics and Geotechnical Engineering, CGtS, Prague, 515–520.
    [30] Ku T, Mayne PW (2013) Evaluating the in situ lateral stress coefficient (K0) of soils via paired shear wave velocity modes. J Geotech Geoenviron Eng 139: 775–787. https://doi.org/10.1061/(ASCE)GT.1943-5606.0000756 doi: 10.1061/(ASCE)GT.1943-5606.0000756
    [31] Hight DW, Gasparre A, Nishimura S, et al. (2011) Characteristics of the London Clay from the Terminal 5 site at Heathrow Airport. Stiff Sedimentary Clays: Genesis and Engineering Behaviour: Géotechnique Symposium, Thomas Telford Ltd. https://doi.org/10.1680/ssc.41080.0016
    [32] BSI, BS 8004: 2015+A1: 2020: Code of practice for foundations. London, UK: British Standard Institute, 2015.
    [33] NSAI, I.S. EN ISO 14688-2: 2018: Geotechnical investigation and testing. Identification and classification of soil. Principles for a classification system. Dublin, Irleand: National Standards Authority of Ireland, 2018.
    [34] ENISO, BS EN ISO 14689-1: 2018 Geotechnical investigation and testing. Identification, description and classification of rock. Part 1: Identification and description. British Standards Institution, London, UK, 2018.
    [35] Farrell E (2024) The 1st Hanrahan Lecture: Geotechnical properties of Irish glacial and interglacial soils. Q J Eng Geol 57. https://doi.org/10.1144/qjegh2023-148 doi: 10.1144/qjegh2023-148
    [36] Lunne T, Berre T, Andersen KH, et al. (2006) Effects of sample disturbance and consolidation procedures on measured shear strength of soft marine Norwegian clays. Can Geotech J 43: 726–750. https://doi.org/10.1139/t06-040 doi: 10.1139/t06-040
    [37] Long M, Quigley P, O'Connor P (2013) Undrained shear strength and stiffness of Irish glacial till from shear wave velocity. Ground Eng 46: 26–27.
    [38] Long M, Donohue S, O'Connor P, et al. (2009) Relationship between shear wave velocity and undrained shear strength of Irish glacial till, Near Surface 2009—15th European Meeting of Environmental and Engineering Geophysics, European Association of Geoscientists & Engineers. Dublin.
    [39] Powell JJM, Butcher AP (2003) Characterisation of a glacial clay till at Cowden, Humberside. Charact Eng Prop Nat Soils 2: 983–1020.
    [40] Poulos HG (2022) Use of shear wave velocity for foundation design. Geotech Geol Eng 40: 1921–1938. https://doi.org/10.1007/s10706-021-02000-w doi: 10.1007/s10706-021-02000-w
    [41] BSI, BS EN ISO 14688-1: 2002: Geotechnical investigation and testing. Identification and classification of soil. Identification and description. British Standards Institution, London, UK, 2002.
    [42] Long M (2023) Practical use of shear wave velocity measurements in UK clays (BGA Touring Lecture 2023). Proc Inst Civ Eng Geotech Eng 178: 70–84. https://doi.org/10.1680/jgeen.23.00158 doi: 10.1680/jgeen.23.00158
    [43] Butcher AP, Powell JJM (1995) The effects of geological history on the dynamic stiffness in soils, XIth European Conference on Soil Mechanics, Copenhagen: Danish Geotechnical Society (DGF), 127–136.
    [44] Looby M, Long M (2007) Deep excavations in Dublin—recent developments. Trans Eng Irel 131: 1–15.
    [45] O'Leary F, Long M, Menkiti CO, et al. (2016) The long term behaviour of retaining walls in Dublin. Proc Inst Civ Eng Geotech Eng 169: 99–109. https://doi.org/10.1680/jgeen.15.00041 doi: 10.1680/jgeen.15.00041
    [46] Hardy S, Nicholson DP, Ingram P, et al. (2018) New observational method framework for embedded walls. Geotech Res 5: 122–129. https://doi.org/10.1680/jgere.18.00013 doi: 10.1680/jgere.18.00013
    [47] Long M (2001) Database for retaining wall and ground movements due to deep excavations. J Geotech Geoenviron Eng 127: 203–224. https://doi.org/10.1061/(ASCE)1090-0241(2001)127:3(203) doi: 10.1061/(ASCE)1090-0241(2001)127:3(203)
    [48] Gaba AR, Simpson B, Powrie W, et al. (2003) Embedded retaining walls: Guidance for economic design. Proc Inst Civ Eng Geotech Eng, 13–16.
    [49] Menkiti CO, Long M (2008) Performance of soil nails in Dublin glacial till. Can Geotech J 45: 1685–1698. https://doi.org/10.1139/T08-084 doi: 10.1139/T08-084
    [50] Menkiti CO, Long M, Milligan GWE, et al. (2014) Soil nailing in Dublin boulder clay. Geotech Geol Eng 32: 1427–1438. https://doi.org/10.1007/s10706-013-9679-6 doi: 10.1007/s10706-013-9679-6
    [51] Odega K (2022) Behaviour of ground anchorages in Dublin soils—Dublin Boulder Clay. School of Civil Engineeing, University College Dublin. Masters thesis.
    [52] Barley AD (1997) The single bore multiple anchor system, Ground anchorages and anchored structures: Proceedings of the International Conference on Ground Anchorages and Anchored Structures Organised by the Institution of Civil Engineers, London, UK, Thomas Telford Ltd, 65–75.
    [53] Gavin K, Cadogan D, Twomey L (2008) Axial resistance of CFA piles in Dublin Boulder Clay. Proc Inst Civ Eng Geotech Eng 161: 171–180. https://doi.org/10.1680/geng.2008.161.4.171 doi: 10.1680/geng.2008.161.4.171
    [54] Lawler M, Farrell ER, Lochaden ALE (2011) Comparison of the measured and finite element-predicted ground deformations of a stiff lodgement till. Can Geotech J 48: 98–116. https://doi.org/10.1139/T10-038 doi: 10.1139/T10-038
    [55] Menkiti CO, Long M (2015) Consolidation settlements in Dublin Boulder Clay, XVIth European Conference on Soil Mechanics and Geotechnical Engineering (ECSMGE), Edinburgh, Scotland: Thomas Telford Ltd, 313–318.
    [56] Phillips E, Lee JR (2013) Development of a subglacial drainage system and its effect on glacitectonism within the polydeformed Middle Pleistocene (Anglian) glacigenic sequence of north Norfolk, Eastern England. P Geologists Assoc 124: 855–875. https://doi.org/10.1016/j.pgeola.2012.07.005 doi: 10.1016/j.pgeola.2012.07.005
    [57] Cabarkapa Z, Milligan GWE, Menkiti CO, et al. (2003) Design and performance of a large diameter shaft in Dublin Boulder Clay, BGA International Conference on Foundations: Innovations, observations, design and practice: Proceedings of the international conference organised by British Geotechnical Association and held in Dundee, Scotland. Thomas Telford Ltd., 175–185.
    [58] Kovacevic N, Menkiti CO, Long M, et al. (2015) Finite element analyses of a cantilever wall in Dublin Boulder Clay, Geotechnical Engineering for Infrastructure and Development, 3983–3988.
    [59] Kovacevic N, Menkiti CO, Long M, et al. (2017) Finite element back-analysis of an anchored wall in Dublin Boulder Clay, 19th International Conference on Soil Mechanics and Geotechnical Engineering (ICSMGE), Seoul, South Korea, 773–776.
    [60] Pedro AMG, Repsold L, Sousa JA (2024) Assessing the sustainability of alternative shaft construction methods. Appl Sci 14: 4476. https://doi.org/10.3390/app14114476 doi: 10.3390/app14114476
  • Reader Comments
  • © 2025 the Author(s), licensee AIMS Press. This is an open access article distributed under the terms of the Creative Commons Attribution License (http://creativecommons.org/licenses/by/4.0)
通讯作者: 陈斌, bchen63@163.com
  • 1. 

    沈阳化工大学材料科学与工程学院 沈阳 110142

  1. 本站搜索
  2. 百度学术搜索
  3. 万方数据库搜索
  4. CNKI搜索

Metrics

Article views(284) PDF downloads(30) Cited by(0)

Article outline

Figures and Tables

Figures(40)  /  Tables(6)

/

DownLoad:  Full-Size Img  PowerPoint
Return
Return

Catalog