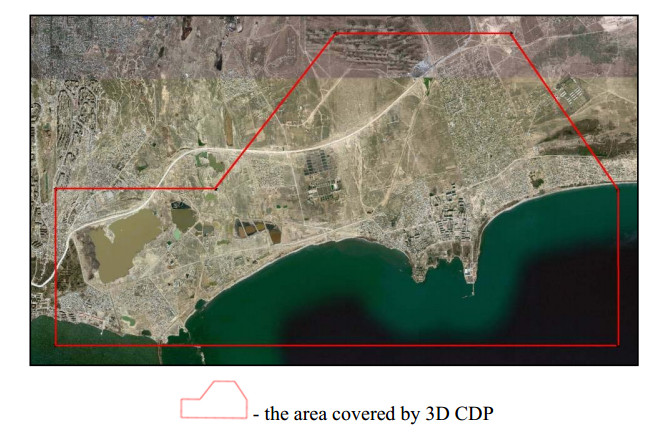
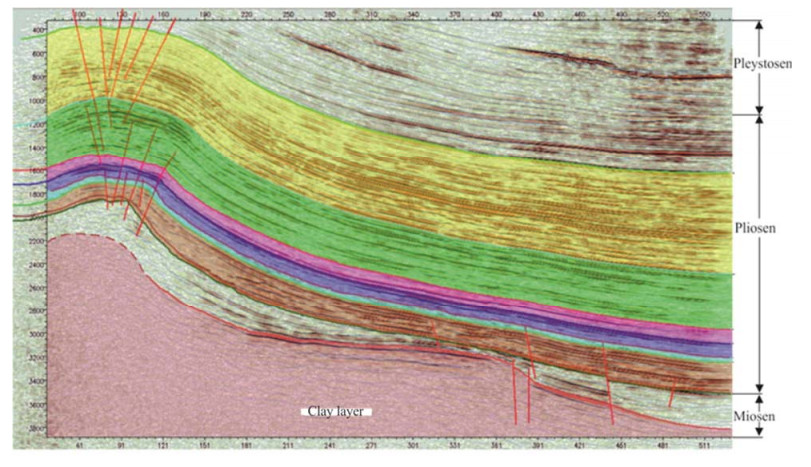
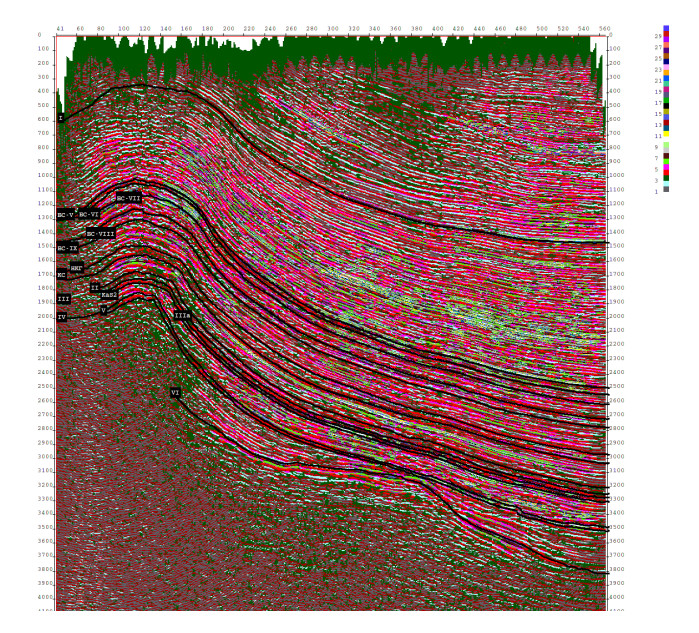
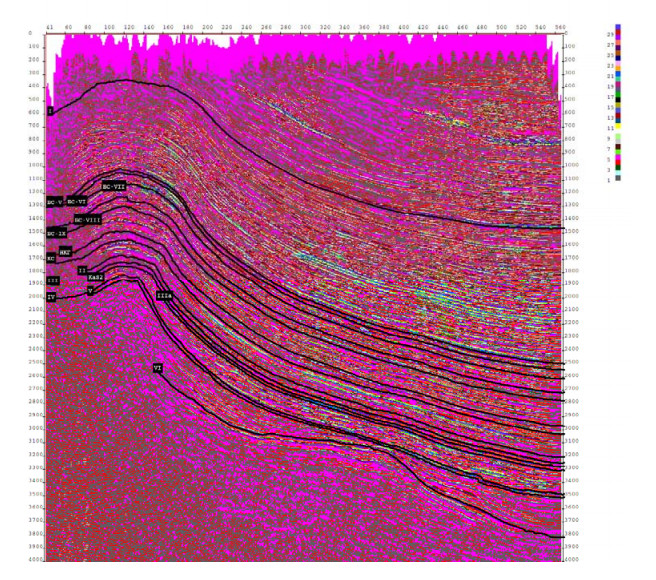
The paper is devoted to outlining of hydrocarbon traps in Absheron suite by use of seismostratigraphy, standardless classification, taxonomy and attribute analysis. The paper gives a brief description of area under the study, its geographical position and research history. Correlation of seismic horizons traced within interval of seismic record embracing Absheron suite has been analyzed in detail. It has been noted that Absheron suite is rich with oil and gas deposits, which has been evidenced by discovery of fields located near to the study area. Six seismic horizons were picked off within the limits of target deposits.
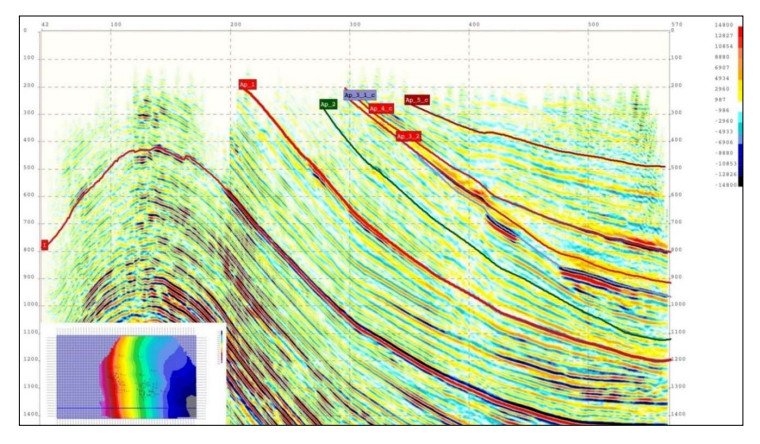
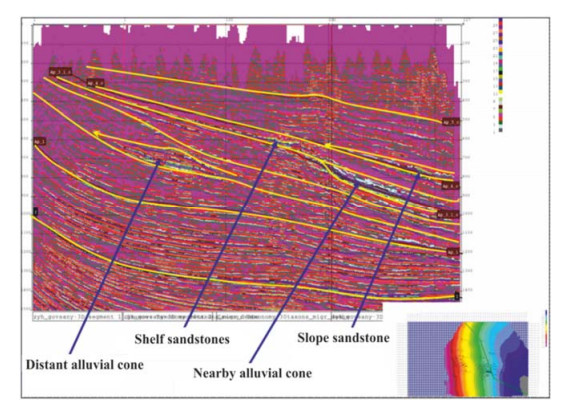
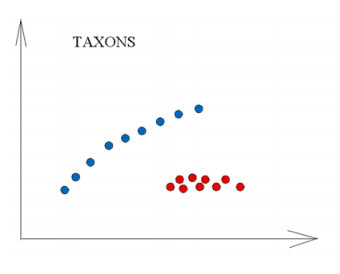
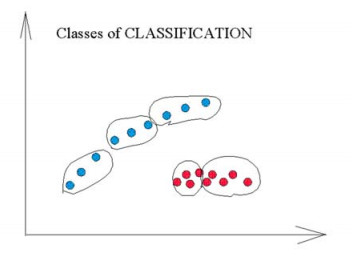
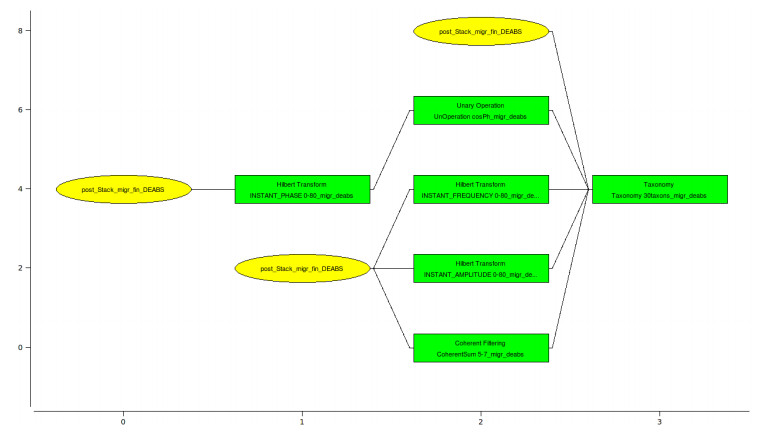
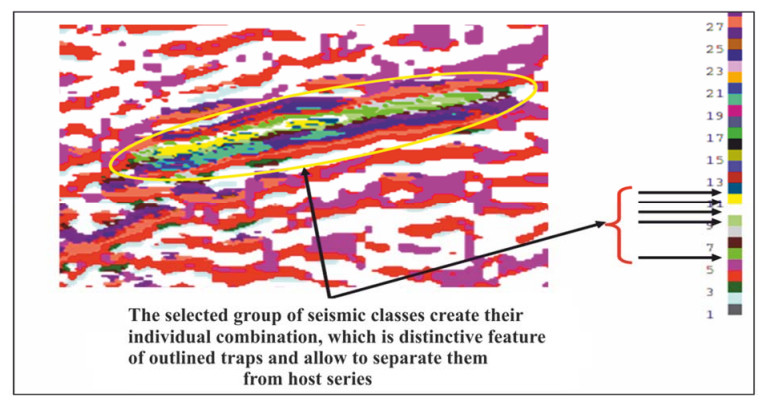
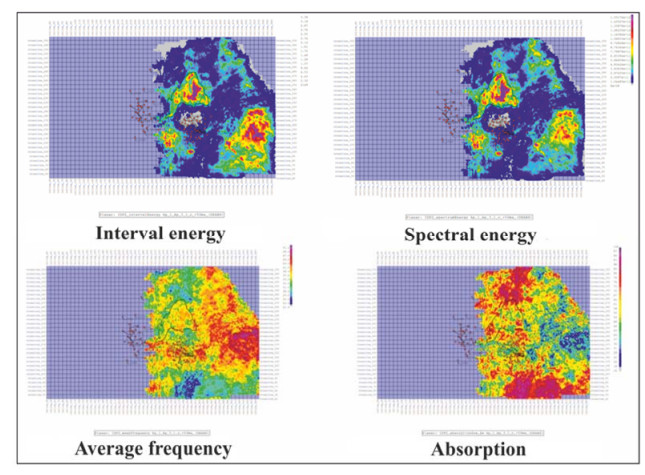
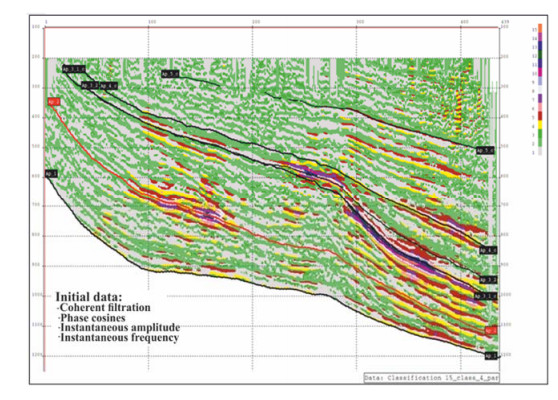
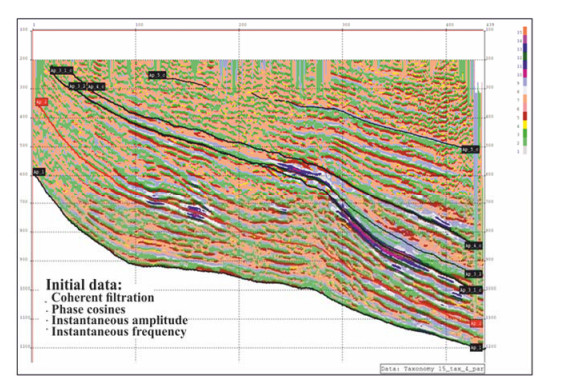
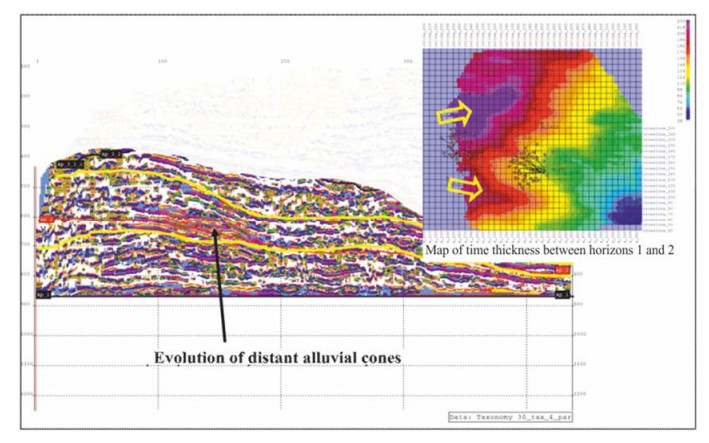
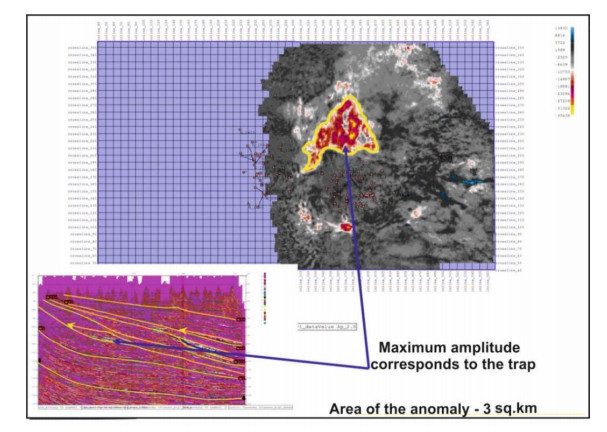
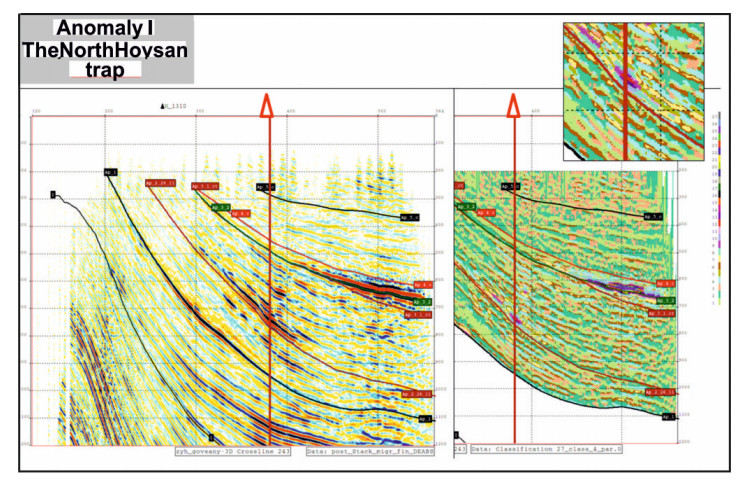
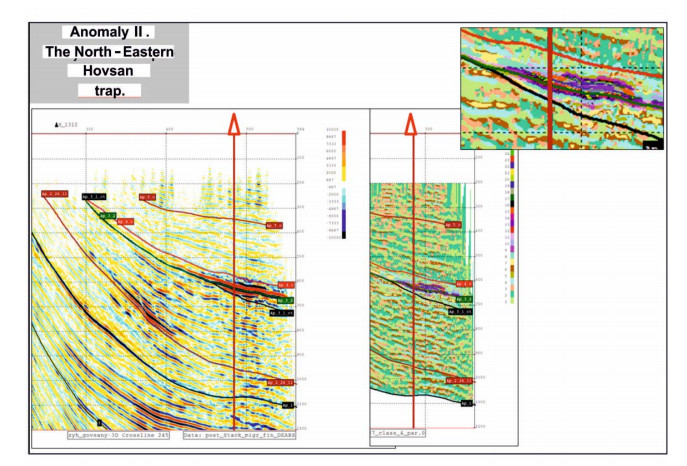
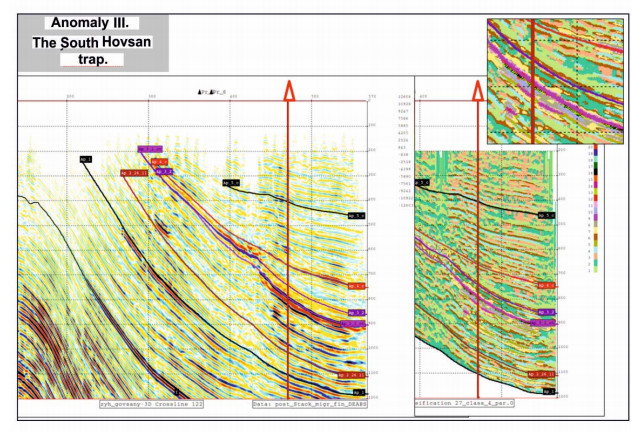
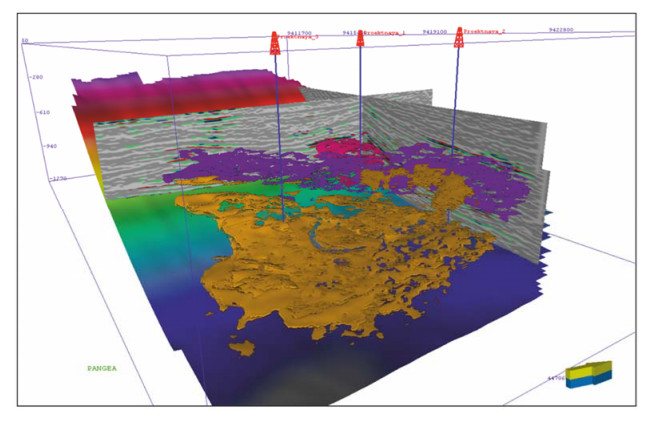
The described methodology of study reveals the essence of applied standardless classification and taxonomy. Analysis of dynamic parameters of seismic record led to outlining of amplitude anomalies related to zones of development of stratigraphic traps attributed to unconformity surfaces. Three such zones have been outlined. Classification and taxonomy cubes have been designed for the interval of Absheron suite. The internal structure of studied series is well traced in sections of "Classification" and "Taxonomy". Classification results allowed to outline traps characterized by abnormal grouping of some classes. Three "bright spot" anomalies are outlined in the Absheron deposits.
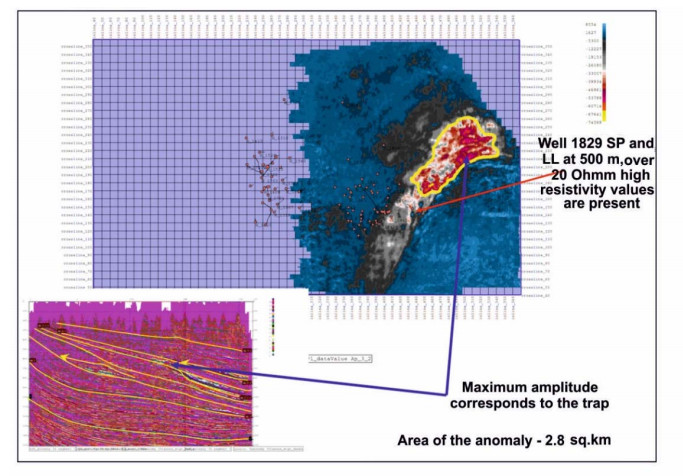
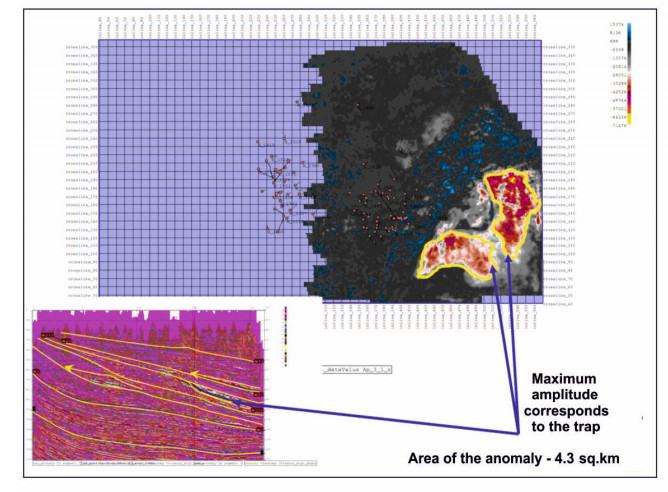
Seismic anomalies are well correlated with sedimentation environment favorable for evolution of stratigraphic traps. The area of anomalies is 10.1 sq.km in summary. Burial depth of these anomalies is 450–950 m. Earlier drilled wells did not recover studied anomalies.
Citation: Tofig R. Akhmedov. 3D seismic survey data processing and interpretation by use of latest tools applied for discovery of new traps in Pleistocene deposits of Hovsan field[J]. AIMS Geosciences, 2021, 7(1): 95-112. doi: 10.3934/geosci.2021005
The paper is devoted to outlining of hydrocarbon traps in Absheron suite by use of seismostratigraphy, standardless classification, taxonomy and attribute analysis. The paper gives a brief description of area under the study, its geographical position and research history. Correlation of seismic horizons traced within interval of seismic record embracing Absheron suite has been analyzed in detail. It has been noted that Absheron suite is rich with oil and gas deposits, which has been evidenced by discovery of fields located near to the study area. Six seismic horizons were picked off within the limits of target deposits.
The described methodology of study reveals the essence of applied standardless classification and taxonomy. Analysis of dynamic parameters of seismic record led to outlining of amplitude anomalies related to zones of development of stratigraphic traps attributed to unconformity surfaces. Three such zones have been outlined. Classification and taxonomy cubes have been designed for the interval of Absheron suite. The internal structure of studied series is well traced in sections of "Classification" and "Taxonomy". Classification results allowed to outline traps characterized by abnormal grouping of some classes. Three "bright spot" anomalies are outlined in the Absheron deposits.
Seismic anomalies are well correlated with sedimentation environment favorable for evolution of stratigraphic traps. The area of anomalies is 10.1 sq.km in summary. Burial depth of these anomalies is 450–950 m. Earlier drilled wells did not recover studied anomalies.

| [1] | Alizade AA, Guliyev IS, Mamedov PZ, et al. (2018) Productive Series of Azerbaijan. Volume Ⅰ & Ⅱ. Nedra. |
| [2] | Ampilov YP (2005) Seismic interpretation: experience and problems. M Geoinformmark, 286. |
| [3] | Abdullayev N, Riley G, Bowman A (2012) Regional controls on lacustrine sandstone reservoirs: the Pliocene of the South Caspian basin. In: Baganz OW, Bartov Y, Bohacs KM, et al. (eds.), Lacustrine sandstone reservoirs and hydrocarbon systems. Tulsa: American Association of Petroleum Geologists Memoir 95. |
| [4] | Ampilov YP (2008) Ot seysmicheskoy interpretatsii k modelirovaniyu i otsenke mestorozhdeniy nefti i gaza (From seismic interpretation to modeling and evaluation of oil and gas fields). Moscow: Spektr, 384. |
| [5] |
Yusof MA, Agi A, Gbadamosi A, et al. (2018) Uncertainly analysis of hydrocarbon in place calculation using 3D seismic and well data during appraisal stage-Case study of Goldie Field. offshore Sarawak. J Nat Gas Sci Eng 57: 238-265. doi: 10.1016/j.jngse.2018.06.038

|
| [6] | Mamedov PZ (2008) Reasons of rapid depression of South-Caspian basin. Azerbaijan Oil Industry, 1: 9-15. |
| [7] | Methodological recommendations (2002) Integrated and staged implementation of geophysical, hydrodynamic and geochemical studies of oil and oil-gas fields/RD 153-39.0-109-01. М..73. |
| [8] | Neff DB, Runnestrand SA, Butler EL (2001) Multi-attribute seismic waveform classification. USA, Phillips Petroleum Company, USA Patent 6223126. |
| [9] |
Chang C, McNeill LC, Moore JC, et al. (2010) In situ stress state in the Nankai accretionary wedge estimated from borehole wall failures. Geochem Geophys Geosys 11: Q0AD04. doi: 10.1029/2010GC003261
|
| [10] | Balz O, Pivot F, Veeken P (1999) Reservoir characterization using neural networks controlled by petrophysical and seismic modeling. In 61th EAGE annual meeting, Extended Abstracts. S015, 1-4. |
| [11] | Flynn MJ (1972) Some computer organizations and their effectiveness. IEEE Trans Comput 100: 948-960. |
| [12] | Kirilov AC, Zakrevskiy KE (2014) Practical training for seismic interpretation by use of PETREL. Мoscow. MAI-PRINT Publishing House, 288. |
| [13] | Loginov DV, Lavrik SA (2010) Some techniques used to define informative set of seismic attributes for prediction of reservoir properties. Oil and gas geology. Theory and practice. Volume 5. |
| [14] |
Marroquin ID, Brault JJ, Hart BS (2009) A visual data-mining methodology for seismic-facies analysis: Part 1-Testing and comparison with other unsupervised clustering methods. Geophysics 74: 1-11. doi: 10.1190/1.3046455
|
| [15] |
Bell R, Sutherland R, Barker DHN, et al. (2010) Seismic reflection character of the Hikurangi subduction interface, New Zealand, in the region of repeated Gisborne slow slip events. Geophys J Int 180: 34-48. doi: 10.1111/j.1365-246X.2009.04401.x
|
| [16] | Ahmedov TR (2016) Geological efficiency of seismic survey while study of non-anticline traps of various type in Azerbaijan. Newsletter of Ural State Mining University. Yekaterinburg, 41-45. |
| [17] | Ahmedov TR (2016) Dynamic analysis of 3D seismic survey in Hovsan area in aim to outline areas perspective for oil and gas. Geoinformatika 4: 2-6. |
| [18] | Barker DHN, Henrys S, Caratori Tontini F, et al. (2018) Geophysical constraints on the relationship between seamount subduction, slow slip and tremor at the north Hikurangi subduction zone, New Zealand. Geophys Res Lett 45: 12804-12813. |
Figures(22)

Tofig R. Akhmedov. 3D seismic survey data processing and interpretation by use of latest tools applied for discovery of new traps in Pleistocene deposits of Hovsan field[J]. AIMS Geosciences, 2021, 7(1): 95-112. doi: 10.3934/geosci.2021005


 DownLoad: