
Citation: Mike Long, Jean Sebastien L’Heureux, Bjørn Kristian Fiskvik Bache, Alf Kristian Lund, Svein Hove, Karl Gunnar Sødal, Helene Alexandra Amundsen, Steinar Nordal, Alberto Montafia. Site characterisation and some examples from large scale testing at the Klett quick clay research site[J]. AIMS Geosciences, 2019, 5(3): 344-389. doi: 10.3934/geosci.2019.3.344
[1] | Tonje Eide Helle, Per Aagaard, Steinar Nordal, Michael Long, Sara Bazin . A geochemical, mineralogical and geotechnical characterization of the low plastic, highly sensitive glaciomarine clay at Dragvoll, Norway. AIMS Geosciences, 2019, 5(4): 704-722. doi: 10.3934/geosci.2019.4.704 |
[2] | Paul W. Mayne, Ethan Cargill, Bruce Miller . Geotechnical characteristics of sensitive Leda clay at Canada test site in Gloucester, Ontario. AIMS Geosciences, 2019, 5(3): 390-411. doi: 10.3934/geosci.2019.3.390 |
[3] | Bruno Di Buò, Marco D’Ignazio, Juha Selänpää, Markus Haikola, Tim Länsivaara, Marta Di Sante . Investigation and geotechnical characterization of Perniö clay, Finland. AIMS Geosciences, 2019, 5(3): 591-616. doi: 10.3934/geosci.2019.3.591 |
[4] | Jean-Sébastien L'Heureux, Anders Lindgård, Arnfinn Emdal . The Tiller-Flotten research site: Geotechnical characterization of a very sensitive clay deposit. AIMS Geosciences, 2019, 5(4): 831-867. doi: 10.3934/geosci.2019.4.831 |
[5] | Don J. DeGroot, Melissa E. Landon, Steven E. Poirier . Geology and engineering properties of sensitive Boston Blue Clay at Newbury, Massachusetts. AIMS Geosciences, 2019, 5(3): 412-447. doi: 10.3934/geosci.2019.3.412 |
[6] | Aleksander S. Gundersen, Ragnhild C. Hansen, Tom Lunne, Jean-Sebastien L’Heureux, Stein O. Strandvik . Characterization and engineering properties of the NGTS Onsøy soft clay site. AIMS Geosciences, 2019, 5(3): 665-703. doi: 10.3934/geosci.2019.3.665 |
[7] | Monica S Löfman, Leena Korkiala-Tanttu . Consolidation properties of clay and gyttja soils: A database study. AIMS Geosciences, 2025, 11(2): 343-369. doi: 10.3934/geosci.2025015 |
[8] | Solve Hov, David Gaharia . Geotechnical characterization of index and deformation properties of Stockholm clays. AIMS Geosciences, 2023, 9(2): 258-284. doi: 10.3934/geosci.2023015 |
[9] | Shehab S Agaiby, Paul W Mayne . CPTU identification of regular, sensitive, and organic clays towards evaluating preconsolidation stress profiles. AIMS Geosciences, 2021, 7(4): 553-573. doi: 10.3934/geosci.2021032 |
[10] | Robert Radaszewski, Jędrzej Wierzbicki . Characterization and engineering properties of AMU Morasko soft clay. AIMS Geosciences, 2019, 5(2): 235-264. doi: 10.3934/geosci.2019.2.235 |
Deposits of marine clay which have been leached of their salt content, and thus have high sensitivity, are found over large areas of Norway, Sweden and Canada. These deposits pose many difficulties for engineers working in such areas. Despite the importance of these materials in Scandinavia and elsewhere there are few publications that report on the properties of quick clay at an individual site in parallel with the results of full-scale field monitoring of geotechnical works. The objective of this paper is to address this issue by presenting a detailed characterisation of the soils at Klett based on the results of routine and advanced laboratory and in situ testing in addition to three full-scale field tests. It is intended that the results presented will form a useful reference to engineers working on such soils.
Several previous papers have detailed the characterisation of quick clays in the Trondheim area for example on the Buvika site [1], the Dragvoll/NTNU campus site [2], Tiller [3], Esp landslide site [4], the Dragvoll salt well test area [5] and the Tiller/Flotten NTGS research site [6].
The research site (Figure 1) was developed by the Norwegian Public Roads Administration (Statens vegvesen), the Norwegian Geotechnical Institute (NGI) and Multiconsult in conjunction with the redevelopment of the E6 motorway in the Klett area, some 13 km south of Trondheim city centre in Norway. Two separate research areas have been developed at Klett and these are referred to as Klett South and Klett North. In both cases extensive laboratory and in situ geotechnical testing has been carried out to supplement the full-scale field testing:
● Klett South: lime cement stabilisation, pile loading tests, study of sampling disturbance effects,
● Klett North: full scale embankment loading, study of sampling disturbance effects. Note that Amundsen [7] refers to the Klett North area as "Leinstrand".
Prior to the development of the area it comprised mostly farmland with gentle slopes, less than 5°, and undulations. There are also several ravines in the area, but none are directly near the test sites. A small area of woodland was located near to the southern research area. Part of the northern area had been previously developed with light industrial units.
The background Quaternary geology of the Klett site area and that of the general area just south of Trondheim is shown on Figure 2. It can be seen that the Klett site is located in a large area of glacio-marine deposits comprising largely marine clays. Seismic surveys at the mouth of the River Gaula, some 4 km north west of the site, suggests that bedrock is at the order of 400 m deep [8]. On Figure 2 the location of several other well characterised quick clay sites is also shown, namely Esp, Buvika, Tiller, Flotten (e.g. the NGTS quick clay site) and Dragvoll. The location of the NGTS sand research site at Øysand [9] is also indicated.
The Klett site area is at a present-day elevation of some 45 m above sea level (a.s.l.). The marine limit (maximum sea level after the last ice age related to today's altitude) in the Trondheim area is found at 175 to 180 m.a.s.l. [10]. The clay deposit formed during the retreat of the glacier after the Younger Dryas stadial between 10, 800–10, 500 years before present [11]. Due to the isostatic depression caused by the weight of the inland glacier, the sedimentation took place in relatively deep-sea water conditions with a salt content of some 30 to 35 g/l. In the salt water the clay minerals were strongly bonded and flocculated in an edge to surface "card house structure", stabilised by strong van der Waals forces [12,13].
Due to post glacial rebound following the ice melting and to the resulting fall in relative sea-level, the marine clays emerged from the sea. According to the shoreline regression curve for Trondheim, the research site at Klett likely emerged from the sea some 6000 years ago (Figure 3). Following their emergence, the marine clays have been exposed to leaching by meteoric water which can dilute the salt pore water. In this process, the bonds between the clay grains have been reduced as the diffuse double layer has expanded [14]. In this situation the repulsive electrostatic forces on the mineral surfaces increase to finally balance the attractive van der Waals forces. The original structure of the clay is intact, but upon a small mechanical disturbance collapse occurs. The clay is in this state referred to as "quick". Quick clays normally have salt contents less than 2 g/l [15] and at salt contents of less than 1 g/l they can behave like a fluid when remoulded [16]. Further details of the geological history of the area can be found in Reite et al. [11] and Reite [17].
Most of the material was derived from glacial erosion of the underlying rocks and the major mineral components are expected to be quartz, feldspar, illite and chlorite with the latter two making up the main proportion of the clay fraction. The bedrock in the Trondheim region was formed for about 500 million years ago [19]. It is dominated by volcanic rocks such as greenstones and tuff. These metamorphosed and moved into place during the Caledonian orogenesis. There are also local outcrops consisting of meta-sedimentary such as sandstone and shales. Most of the clay material that deposited in the fjord derived directly from glacial erosion of the bedrock, but also from erosion of glacial deposits in the Holocene. The major mineralogical components of the bedrock and glacial deposits in the catchment are quartz, feldspars, illite and chlorite with the latter making up the main proportion of the clay fraction.
The stratigraphy at the North and South sites is very similar and can be divided into four units based on laboratory and in situ testing. Unit Ⅰ is approximately 2 m thick, found immediately below the ground surface, and consists of desiccated and weathered clay (dry crust). The second unit (Unit Ⅱ) is found from 2 m to 7.5 m depth and consist of a low to medium sensitivity clay. The boundary between Unit Ⅱ and Ⅲ is define by a sharp increase in sensitivity. The clay of Unit Ⅲ has a remoulded shear strength below 0.5 kPa and is defined as a quick clay. Soundings and laboratory results show that Unit Ⅲ can be found down to depths of 30 m below the ground level. Low to medium sensitive clays are found below Unit Ⅲ. Seismic surveys at the mouth of the River Gaula, some 4 km north west of the site, suggests that bedrock is at the order of 400 m deep [8].
From the geological history of the area, no exceptional loading events are known; only normal sedimentation processes. (An exception may be the influence of some old landslides at Klett North, see below). Once above sea level, groundwater fluctuations may have induced some changes in stress history. Groundwater level is presently located 1 m to 2 m below ground level. Numerous piezometers were installed as part of the highway construction program. Data for the Klett South area are shown on Figure 4. The groundwater pressure shows a nearly hydrostatic distribution with groundwater level close to the surface down to about 7 m below ground level. At 10 m depth the pore pressure corresponds to hydrostatic conditions at 2 m depth. Below 10 m the pore pressures are lower and approximately 80% to 90% of the 2 m hydrostatic conditions. It is though that the downward gradient observed is caused by drainage to the west and north of the area due to regional groundwater flow in the area and the large differences in ground elevation.
Preconsolidation stress (σp') was estimated from oedometer tests on three different sample types at the Klett South site by [20]. These samplers comprised Geonor/NGI 54 mm and 75 mm fixed piston samplers in addition to 160 mm diameter mini-block samples [21]. In addition mini-block samples were obtained at the Klett North/Leinstrand site [7]. Values of (σp') were obtained using the Janbu approach [22] which involves selecting the effective stress value where the constrained modulus (M), coefficient of consolidation (cv) and if available the creep number (rs) reach a minimum in plots of these parameters versus vertical effective stress.
The results for constant rate of strain (CRS) oedometer tests on the best samples (i.e. those for the mini-block only) are shown on Figure 5a. All of the values are above the in situ vertical effective stress (σv0') line throughout the profile. The corresponding overconsolidation ratio (OCR) values are shown on Figure 5b. There is a significant contrast in the results for Klett South and Klett North. It is possible that the Klett North clays are somewhat more overconsolidated. It has been shown previously for the Trondheim area [4] that an overview of landslide scars and ravines which appear on the LiDAR map give new opportunities for understanding landscape development in marine clay areas. The LiDAR image for the Klett area is shown on Figure 6. There are several landslide scars in the region. It is possible that the Klett North site could be close to the toe of an old landslide. This could possibly explain in part the higher OCR recorded to 8 m. It is possible that some overlying material was eroded during a landslide.
For Klett South the OCR values remain more or less constant with depth at a value of about 1.25. The reason for the slightly overconsolidated state of the material at Klett South is thought to be due to "delayed consolidation"/creep or natural ageing effects [23].
Little data are available on the mineralogy of Klett clay. However as part of a larger study into the mineralogy of Norwegian clays, Syversen [25] presented some results for Klett clay which are reproduced on Table 1 below. These samples were from depths of 11.3 m (No. 100) and 6 m to 6.9 m (101).
Minerals | Bulk fraction | Clay sized fraction | |||
Sample 100 Approx. (%) | Sample 101 Approx. (%) | Sample 100 (%) | Sample 101 (%) | ||
Chlorite | 23.2 | 22.5 | 22.9 | 24.9 | |
Illite | 58.3 | 62.4 | 77.0 | 75.0 | |
Amphibolite | 1.2 | 0.9 | |||
Quartz | 8.7 | 6.1 | |||
Microline | 5.6 | 2.9 | |||
Plagioclase | 3.1 | 5.3 | |||
Feltspar | 8.7 | 8.1 |
This X-ray diffraction analysis showed that both the bulk and clay sized mineralogy is dominated by the clay mineral illite and also by chlorite. The relatively high percentage of chlorite present may be due to the fraction present in the silt and sand particles. Syversen [25] found that the results for Klett clay were very similar to those from the nearby Dragvoll and Esp sites. Note that the bulk fraction results presented in this work needs to be treated with caution as the sum of the components exceeds 100%.
Klett clay is an inhomogeneous low plasticity clay layered with silt. The presence of the higher permeability silt layers is of particular importance from the point of view of sample disturbance both in the field and the lab. It is possible that dissipation of excess pore pressure along silt lenses could cause material densification during sampling. Suctions will be reduced following sampling stress relief and the presence of the lenses makes specimen cutting and preparation more difficult. Observations of split core samples also showed evidence of iron sulphide spots (dark spots) that are commonly the result of the decomposition of organic matter in marine sediments. Some of these features will be discussed in more detail in Section 5 on sample disturbance effects.
Particle size distribution curves for both research areas are shown on Figure 7a and clay and silt content with depth is given on Figure 7b. The range of values for the nearby Tiller clay [3] is also shown on Figure 7a. The Klett clays fall to the lower (coarser) end of the range for Tiller. There is a good degree of consistency between the two sets of tests with the results confirming that the soils in the two test areas are very similar. Overall the average clay and silt contents are about 30% and 67% respectively. Both values appear to be relatively constant with depth. The remaining material comprises minor amounts fine sand. According to NGF [26], as the material has a clay content greater than 20%, it should be classified as a silty clay.
Particle density values (G) for Klett clay all fall within a narrow range of 2.63 to 2.82 with an average of about 2.72. There is some scatter in the data due to the nature of the test and the small amounts of material involved. These are typical values for Norwegian clays. No differences were observed between the data for the two test areas.
Limited data exist on the organic content of Klett clay. Tests at the Northern research areas showed organic content values ranging between 1% and 1.5%.
Salt content values for the pore fluid are shown on Figure 12c. Values are low and range between 1 g/l and 4 g/l, with an average of 2.0 g/l. There is no clear pattern with depth. These data suggest that the material has been leached post deposition over the entire studied thickness.
Water content (w) values from the various investigations are shown on Figure 8a for Klett South and Figure 9a for Klett North. For Klett South the values are uniform, indicate the relatively homogenous nature of the material and show a slight tendency to decrease with depth from about 35% at 2 m to 30% at 35 m depth. For Klett North the values are somewhat more variable with an overall average of about 30% and no clear pattern with depth. The greater variability and slightly lower values may be partly due to the higher OCR of this material. The material below the dry crust (i.e. below about 2 m) is fully saturated.
Bulk unit weight (γ) values from the various investigations are shown on Figure 8b for Klett South and Figure 9b for Klett North. These values show somewhat more scatter then the equivalent water content data. This is likely to be due to the presence of thin silty lenses in the bulk material. For both test areas the values range between 18.5 kN/m3 and a maximum of 20.5 kN/m3 with no clear pattern with depth. The overall average value is about 19.5 kN/m3.
Plasticity index (Ip) is plotted against depth on Figures 8c and 9c for Klett South and Klett North respectively. There is a good degree of consistency between the various investigations and the data for both test areas are very similar. The overall trend is for the values to fall from about 7% at 2 m depth to about 4% with depth. However all the material can be classified as being of "low plasticity" [26].
The data are also plotted on the "A" line chart on Figure 10. The measured values are similar for both test areas and all (except for some data for the dry crust) fall in the zone "CL", i.e. are classified as clay of low plasticity. This classification is consistent with that from the particle size distribution curves presented above.
Liquidity index (IL) can be a very useful parameter for assessing the structure and stress history of the material. It has been shown to correlate well with compressibility, strength and sensitivity properties of fine grained materials [27]. It is defined as:
IL=w−wPIP | (1) |
where: wP = plastic limit.
If the water content equals the liquid limit (wL) IL will of course equal 1.0 and if the water content exceeds the wL, IL will exceed 1.0. According to [28] the relationship between IL and remoulded shear strength (cu, rem) can be expressed as follows:
Cu,rem=1(IL−0.21)2 | (2) |
If IL exceeds about 1.6, this expression suggests that cu, rem will be less than 0.5 kPa suggesting that the material will be very sensitive or even quick. Data for Klett, shown on Figure 11 show the values to increase with depth from about 1.0 in the upper layers to values up to 7.0. Overall the values are very high suggesting the material will be very sensitive/quick. The 1.6 value limit seems to work well here. Limited data for Klett North suggest slightly lower values for this area.
These IL values suggest that the material possesses a high degree of structure and is consistent with that which has been deposited slowly in still water leading to an open random fabric [29].
The Klett clay is expected to have high degree of sensitivity due its geological history which lead to a flocculated and likely open material structure, the low salt content of the pore water and to the high values of liquidity index. According to [26] a material is "very sensitive" if sensitivity (St) values are greater than 30 and furthermore can be termed "quick" if the remoulded shear strength (cu, rem) values are less than 0.5 kPa. Fall cone data shown on Figures 12a and 12b for Klett South and 13a and 13b for Klett North.
These data show that above about 7 m at Klett South and 6 m at Klett North the material is not quick and is of low to medium sensitivity. However, below these depths the material has very high sensitivity and is quick. At Klett South there is some evidence to suggest the material is no longer quick below about 30 m. These is a good degree of consistency between the various investigations.
Some limited field vane data are available for Klett South as shown on Figure 12b. In general, the values are higher than those obtained from the fall cone. This finding is consistent with that for other Norwegian clays [30], especially quick clays, and is attributed to uncertainties in rod friction and torque measurements taken from the surface.
Physical inspection of the behaviour of the samples confirms that the material in the quick clay zone is highly sensitive and remoulds to a liquid easily on agitation.
Despite the clear distinction between the low to medium sensitivity clay and quick clay at about 7 m at Klett South, the salt content of the pore fluid remains more or less constant throughout the profile with an average value of about 2 g/l. Considering that the material was deposited in marine conditions, it is clear that the material has been leached throughout the profile. This finding, which is common for many Norwegian sites, poses a significant challenge in characterising these materials.
Distinguishing between quick and non-quick clays is a major challenge for geotechnical engineers in many places especially Scandinavia and North America. Traditionally in Norway use is made of either rotary pressure soundings or total soundings to delineate quick clay zones. Plots are made of the penetration resistance versus depth and the zones over which the penetration resistance remains constant or decreases with depth are considered to be likely quick clay zones. For full details of the methods the reader is referred to NGF [31], NGF [32] and Multiconsult [30].
Some examples for Klett South and Klett North are shown on Figures 14 and 15 respectively. Broadly speaking the methods work well, especially for the Klett South site.
An alternative approach is to use the results of piezocone (CPTU) tests). Some CPTU data for Klett South in the form of qt (corrected cone end resistance), fs (sleeve friction) and pore pressure generated at the shoulder of the cone just behind the filter (u2) versus depth is shown on Figure 16. The data for the two tests at Klett South (both by Multiconsult using a Geotech cone) show very similar results. Note that the ambient pore pressure values (u0) have been calculated assuming hydrostatic pore water pressure conditions from 2 m depth.
It is not easy to distinguish between the non-quick and quick clay data from the qt and fs results only, thought there does appear to be a reduction in the fs values to their minimum value at the top of the quick clay layer.
The data are plotted on the classical soil behavior type chart (SBT) on Figure 17 [33]. Here qt values are plotted against the pore water pressure parameter Bq and the friction ratio Rf ( = 100* fs/qt). Bq is defined as:
Bq=qnet=qt−σv0u2−u0 | (3) |
where: σv0 = total overburden stress.
The qt/Bq chart works well in distinguishing between the two layers with the non-sensitive clay and quick clay both falling in Zone 3 "clay" but the plot indicating the non-quick clay has higher OCR and the quick clay has higher sensitivity. The qt/Rf chart also works reasonably well with both layers falling in Zone 1 "sensitive fine-grained soils". However, a significant portion of the quick clay data also falls in Zone 6 "sandy silt to clayey silt".
Care needs to be taken when using fs values in materials like those found at Klett. It is important to assess these results in the context of Application Class 1 (for use in soft soils) of the European Standard [34], which requires that the "minimum allowable accuracy" should be the larger of:
● qt = 0.035 MPa or 5% of measured value
● fs = 5 kPa or 10% of measured value
● u2 = 0.01 MPa or 2% of measured value
For Klett the measured qt and u2 values are significantly greater than the required accuracy. However, the fs values are often less than the value required by the Standard. Measured sleeve friction will be influenced by various factors such as the condition / wear of the sleeve and the surface roughness [35,36,37]. A series of parallel CPTU's were carried out at both the Onsøy and Tiller—Flotten NGTS sites using seven different cones from five manufacturers [37] and [38]. The main objective of the work was to check the influence of equipment type and to evaluate if cone penetrometers used for commercial and research projects can meet the requirements of Application Class 1 of the European Standard. It was shown that the qt and u2 values showed relatively small variation (especially u2) but relatively large variation was shown in the fs readings.
It has also been shown that if the normalised pore water pressure parameter Bq exceeds 1.0 then there is a strong possibility that the material under question is quick, see [39] or [30]. The Klett South data shown on Figure 16c demonstrates that the Bq > 1 criterion works very well in distinguishing the quick clay zone at this site.
As part of the NIFS project, see [30] and [40] an alternative CPTU based chart was developed in an attempt to characterise quick and non-quick clays. This chart involves a plot of Bq1 versus Nmc. Bq1 is the pore pressure corresponding to pore pressure measurement on the tip of the CPTU. Here Bq1 has been taken to equal 1.25 times Bq [41]. Nmc is defined as:
Nmc=qnetσ′A+a′ | (4) |
σ′A=σ′mp∗σ′(1−m)v0 | (5) |
where: a' = attraction and m = stress exponent, taken to = 0.8 [42].
Klett South CPTU data are plotted in this form on Figure 18. The chart works well in separating the non-quick clay from the quick clay and the actual quick clay is characterised as either "sensitive/brittle clay" or "quick clay".
However, sampling/laboratory testing or rotary pressure/total sounding or CPTU testing all involve some form of relatively expensive intrusive testing. Recently efforts have been made to use non-intrusive methods in order to characterise quick clays. An example of such a method is ERT (electrical resistivity tomography). It has been shown by various authors, e.g. [1] or [43] that if the measured resistivity is very strongly influenced by the salt content of the pore fluid and if the measured value falls in the range 10 Ωm to 100 Ωm then the material is likely to have been leached (but is not necessarily quick).
Significant efforts have been made to show that ERT gives reliable results for these materials. Some examples for Klett South and Klett North are shown on Figures 19 and 20 respectively. Here ERT data are compared to data measured using the resistivity CPTU (RCPTU) and it can be seen for all practical purposes the measured values are the same. For Klett South different inversion parameters, such as the number of layers assumed in the model, were also varied and did not influence the results significantly.
In both cases the data show that at least as far as 25 m to 30 m depth the material has been leached. However, the data fail to distinguish the quick and non-quick zones. It seems that the material above about 7 m has been "over-leached", i.e. it was once quick but continued ion exchange activity has turned the previous quick clay into a non-quick clay. It is important to realise that the formation of quick clays is a dynamic process. For full details of these phenomenon, see [44] or [45].
It is important to highlight the effects of sample disturbance on the quick clay from Klett. Significant work on this topic has been carried out as part of the PhD thesis by Amundsen, see [7], [20] and [46]. This section presents a short summary of the studies that were done on the Klett clay. It is sub-divided into three parts namely (ⅰ) a comparative study involving tests on samples of Klett clay taken using various sampler types, (ⅱ) results of parallel testing at two different laboratories and (ⅲ) influence of storage time on test results.
The Klett clay is an inhomogeneous low-plasticity clay layered with silt. This type of clay is challenging to sample, handle and test without disturbing its soil structure. Cutting through an inhomogeneous clay containing several silt layers with a sampling tube is particularly damaging to the soil structure, even when the tube is thin-walled steel with sharp cutting edges. This is because additional force is required to overcome the increased resistance in the varying layers, thereby increasing the burden on the weaker layers beneath. This is illustrated on Figure 21a which shows the layered quick clay from Klett sampled with a 75 mm diameter piston sampler and a 160 mm diameter mini-block sampler. The samples are taken from the same depth of 18 m and contain silt layers of about 3 mm to 6 mm thickness. The silt layers are visibly highly disturbed in the piston sample, whereas in the mini-block sample they are intact. This illustrates an apparent higher sample quality of the mini-block samples, compared to the piston samples.
The results from triaxial tests conducted on the Klett South quick clay samples are shown on Figure 21b. These were anisotropically consolidated undrained compression tests (CAUC) carried out to the procedures outlined by [47] and [48]. Both samples were transported about 13 km to the laboratory and tested shortly after sampling. A higher quality sample of the mini-block is also visible in the test results. The mini-block sample exhibited about 15% higher peak undrained shear strength (suC) and lower axial strain at failure compared to the 75 mm piston sample.
The effect of sampler type is also visible in the CRS oedometer test results [20] using the results of nine CRS tests on samples recovered using the Geonor/NGI 54 mm and 75 mm fixed piston samplers [49] in addition to 160 mm diameter mini-block samples [21]. The tests were conducted to the procedures outlined by [50] and [51]. Figure 22a, b shows the test results from Klett South and Figure 22c shows the results from the Klett North site. The results are shown in terms of plots of vertical effective stress (σv') against vertical strain (ev) and constrained modulus (M) versus σv'.
The test results presented on Figure 22 show that the mini-block samples (Tests 1–3) have best retained their structure following sampling. It is easy to identify the preconsolidation stress (σp') for all of the mini-block tests using both the σv'-εv and the σv'-M plots. The constrained modulus at in situ stress (M0) and at σp' (ML) are well defined. In the piston samples most of the test results show clear signs of sample disturbance (Tests 5–6 and 7–8).
The quality of the samples has been assessed using the two well know criteria; Δe/e0 detailed by [52] and M0/ML [42] as shown on Figure 23. According to the Δe/e0 criterion all of the samples (Tests 1–9) are of "poor" quality. In contrast the M0/ML criterion classifies all of the mini-block samples as either "very good to excellent" or "good to fair" with the rating for the piston tube samples being variable. The two most clearly disturbed tests (Test 6 and 7, see Figure 23) are rated as being either "poor" or "very poor" by both criteria.
As well as destructuration or densification due to tube sampling, stress relief also significantly affects the sample quality. It is likely that stress relief effects will be more pronounced for the block samples compared to the tube samples as the latter will retain some support from the tube walls. However, the physical disturbance of the soil structure during piston sampling seems to have a more significant effect on the sample quality than the effect of stress relief in block samples. In both cases, it may take a high vertical strain to restore the in-situ stress conditions during reconsolidation, which result in poor sample quality according to the Δe/e0 criterion [52]. The M0/ML criterion, however, is able to differentiate between tests that are clearly heavily disturbed and tests that can be used for interpretation of material properties. Finally, it is important to mention that the calculated M0/ML value is highly sensitive to small changes in ML, which lends itself to personal judgment. Further work is required in order to establish a robust sample quality assessment method for samples of materials such as low-plasticity sensitive clays.
Two different laboratories, Lab 1 and Lab 2, participated in the parallel testing of mini-block samples from Klett South. The samples were transported about 13 km to Lab 1 where they were opened and divided into smaller pieces. The clay pieces were wrapped in plastic film and were transported about 4 km to Lab 2. The samples were transported on a rigid plate and tested on the same day. All of the specimens were trimmed immediately before testing.
The time difference between opening the sample and testing was between 0.4 hours (Lab 1) to 4.5 hours (i.e. somewhat later in Lab 2). The laboratory tests included 50 mm diameter CRS oedometer tests with strain rate of 0.7%/hr and CAUC triaxial tests (K0'assumed = 0.8) on specimens trimmed to 54 mm in diameter and with 1.2%/hr rate of shear strain. The test results from CRS oedometer and CAUC triaxial tests are shown on Figures 24 and 25 respectively.
The oedometer test results from two block samples, from 10 m and 15 m, show that tests carried out in Lab 1 are less affected by sample disturbance than the parallel results from Lab 2. The tests from Lab 1 are easier to interpret and have considerably larger M0. Also, the recompression index (Cs) and compression index (Cc) indicate sample disturbance in the tests from Lab 2.
The triaxial test results from the same block samples are shown on Figure 25. A significant reduction in peak undrained shear strength, about 23%, is observed in tests conducted at Lab 2. The same samples also show higher pore pressure response and more contractive behaviour.
The observed differences in oedometer and triaxial test results between the laboratories may be explained by several factors, such as transport, short-term storage and stress relief, handling procedures and small dissimilarities in laboratory procedures. Short-term storage or a delay in the laboratory testing of an open sample may reduce the measured preconsolidation stress, constrained modulus and peak undrained shear strength. This implies that the sample should be tested as soon after sampling as possible and testing of an open block samples should not be delayed even with a few hours.
When obtaining a block sample, the total stresses on the soil change from those in-situ to zero as the sample is extracted from the ground. The stress change leads to swelling, which is prevented by a negative pore pressure that develops in the soil [54]. The process of stress relief occurs during sampling and storage, while the negative pore pressure dissipates.
For low-plasticity sensitive clay, the dissipation of the negative pore pressure may occur during and shortly after the sampling due to high permeability of the silt/silty layers [55]. The consequences may be critical in terms of sample quality and soil behaviour, especially for low-plasticity sensitive clay samples. Figure 26 illustrates the effect of stress relief over the course of 2 to 15 days of storage on the Klett clay from the North and South sites. All samples were stored and tested at the same laboratory. The results indicate that mini-block samples stored for a short period can exhibit a lower peak undrained shear strength, about 11% to 14%. Similar observations were made for other low-plasticity sensitive clay samples [7] and also in oedometer test results, where the preconsolidation stress, constrained modulus and sample quality decreased during storage. It is therefore not recommended to store samples of this type of material, neither block samples nor piston samples, as they may exhibit poorer sample quality, lower preconsolidation stress and peak undrained shear strength [7], [56]. A long-term storage of block samples, or soil samples that have been exposed to air, may cause ageing of the clay, which affects the soil sensitivity, Atterberg limits and pore water chemistry.
Small strain shear stiffness (Gmax) can be estimated from the shear wave velocity (Vs) using the formula:
Gmax=ρV2s | (6) |
where: Gmax is the shear modulus (in Pa), Vs is the shear wave velocity (in m/s), and ρ is the density (in kg/m3).
Four sets of Vs data are available for Klett South as shown on Figure 27a. Three of these were obtained using the MASW (multichannel analysis of surface wave) technique and one from the seismic cone (SCPTU). The MASW profiles were obtained in the lime/cement column test area (Profile S1, see Figure 1), just adjacent to the lime/cement column area (S2) and at the main Klett South test area (BH's KS1/1502 and KS2/1503), i.e. Profile M1. The SCPTU profile was adjacent to M1. The measured values are all very similar and show Vs to increase from about 125 m/s at 2 m to 250 m/s at 25 m depth. These are characteristic values for Norwegian soft marine clays [57,58,59] and are very similar to measured values for other sites in the Trondheim area. The scatter in the SCPTU data are likely to be due to the instrument used having one geophone only, hence resulting in some inaccuracy in the derived Vs readings. The MASW data suggest that the technique is not able to resolve the effect of the lime/cement treatment.
It is also possible to obtain estimates of the Vs profile from CPTU data and the literature contains many attempts to correlate CPTU and Vs data. Three examples are shown on Figure 27b i.e. Vs determined from CPTU based on qt ad e0, based on qt and Bq [58] and finally based on qt, sv0' and w [59]. The qt/e0 method works well over the top 10 m or so but then fails to show any increase in Vs with depth. Both the other methods give good estimates of the Vs profile below 10 m. It is recommended that in any attempts to correlate between CPTU data and Vs several methods are trialed, and reliance is not placed on a single method only.
The equivalent Gmax values (Figure 27c) thus increase from 45 MPa to 135 MPa (average ρ = 1.99 Mg/m3 assumed). These are typical values for Norwegian soft marine clays [58].
Some examples of the results of constant rate of strain (CRS) oedometer tests on mini-block samples from the quick clay zone between 10 m and 15 m are shown on Figures 22a. The test results are presented in σ'v versus strain (ε) format and as constrained modulus (M = δσ'/δε) versus σ'v. On Figure 24, the 10 m mini-block data are also shown in conventional log σ'v versus void ratio (e) and compression index (Cc) format. M values are highest in the overconsolidated zone and then drop sharply as σp' is approached before increasing again linearly with stress post σp'. (In this zone the slope of the M-σ'v line is the modulus number, m.). This behaviour is classical for a structured clay.
Values of the constrained modulus in the overconsolidated range (M0) and at the preconsolidation stress (ML), for the block samples only, are shown on Figures 28a, b respectively. The amount of data available are very limited. Nonetheless they suggest that M0 values are higher for Klett North being about 11 MPa and lower for Klett South with an average value of some 4 MPa. In contrast ML values are higher for Klett South. Overall the average ML is about 2 MPa.
Values of the modulus number (m = the slope of the M-σv' plot after σp') are shown on Figure 28c. The values seem more or less uniform with depth and range between 18 and 26. The measured values agree very well with the correlations of Janbu [60] for an average water content of 32%.
Coefficient of consolidation values in the overconsolidated zone (cv0) and at about σp' (cvL) are shown on Figures 29a, b respectively. Again, the quantity of data available are limited. Values of cv0 are much higher for Klett North. The average value cvL is about 5 m2/yr. which is at the lower bound of the minimum value suggested by Janbu [60] for material with w of 32%.
Results of CAUC triaxial tests are shown on Figures 21, 25 and 26. These tests were carried out on mini-block and 75 mm diameter piston samples from the quick clay zone. On Figure 21 results are presented in normalised shear stress (σa' — σr')/2σv0' versus axial strain (ε) format. In addition, on Figures 25 and 26 stress path plots (in NGI s'/t' format) and pore pressure data are also presented. All tests show that the mini-block samples behave in a contractive strain-softening manner. Samples from all depths tested show a pronounced peak at ε of about 1%. Post peak considerable strain softening is evident. The near initial verticality of the initial part of the stress path plots confirm that the samples have retained much of their structure.
Index undrained shear strength (su) tests from fall cone and unconfined compression tests on a variety of sample types are shown on Figure 30a. Both sets of data show the same trend. On average the Klett North values are higher than those from Klett South. Above about 7 m, i.e. in the non-quick zone, su values are relatively high, between 20 kPa and 50 kPa, probably reflecting the higher degree of overconsolidation in this zone. Minimum su is recorded towards the top of the quick clay zone and then su values increase gradually with depth but fall well below 0.3σv0' line, which corresponds to a normally consolidated material [61]. The reason for this is due to the combined effects of sample disturbance and the fact that the laboratory tests are carried out without a confining stress.
Undrained shear strength values from CAUC tests on mini-block samples are shown on Figure 30b. For the CAUC tests the best estimate of the in-situ stress was used (assuming ground water pressures were hydrostatic from 2 m depth) for consolidation with K0' assumed to be 0.7 to 0.8. Because the specimens were the best available and were reconsolidated back to the in-situ stress, these tests give su values higher than those of the index tests. Normalised strength (su/σv') values fall from about 0.52 towards the top of the quick clay zone to close to 0.3 at 18 m depth.
Ladd et al. [62] proposed that su be expressed in a normalised form (su/σv') in relation to the overconsolidation ratio (OCR) as follows:
suσ′v=S(OCR)m | (7) |
where S is the normally consolidated stress ratio. The principal behind this approach was called the SHANSEP procedure. Although it was strictly speaking developed for tests on artificially overconsolidated clays, [42] considered that the same framework could be used for work on su values derived from high quality samples. These authors found that on average for Norwegian clays:
● CAUC: S = 0.30, m = 0.70
● CAUE: S = 0.12, m = 0.80
● DSS: S = 0.22, m = 0.80
For Klett South with S = 0.3 and m = 0.7 and OCR = 1.25 (from Figure 5b), su/σv' = 0.35 for the CAUC tests. This value is consistent with the results shown on Figure 30b.
Undrained shear strength can be obtained by empirical correlation from CPTU data using various techniques for example [36]:
su=qt−σv0Nkt | (8) |
su=u2−u0NΔu | (9) |
where Nkt and NΔu are empirical bearing capacity factors and apply only to the type of shear strength from which they were derived.
Karlsrud et al. [63] derived a series of bearing capacity factors for Norwegian clays by comparing research standard CPTU tests with CAUC (anisotropically consolidated compression test) triaxial tests on Sherbrooke block samples. They related Nkt and NΔu to St and OCR. For Klett clay typically Nkt and NΔu can both be chosen to be equal to 8. The derived su values compare very well with the CAUC triaxial test results, see Figure 30c.
Effective friction angle (ϕ'), cohesion (c')/attraction (a') can be inferred from the CAUC test results on Figure 25. These tests suggest that ϕ' is in the range 26° to 28° and c' varies between 7 kPa and 9 kPa (i.e. a' varies between 14 kPa and 18 kPa).
The Norwegian practice for estimating friction pile capacity in clay makes use of a semi-empirical method. In this method a side friction factor is employed to estimate the share of the direct undrained shear strength that can be use in the ultimate limit state. For low plasticity clays, Norwegian standards usually recommend using a low side friction factor. Such an approach often leads to conservative and costly design. In reality, aging effects can provide a significant increase in capacity after clay reconsolidation as shown for example by [64]. However, but such effects are seldom considered in practice.
A tension pile capacity test was in this respect performed at the Klett South site between 2014 and 2015. The location of the test area is shown on Figure 1. As the new four-lane E6 highway included construction of two bridges, friction piles were considered for use as the foundations. The aim of the tests was to assess how the piles would perform in quick clay as the clay would be remoulded on pile driving and take some time to reconsolidate. A detailed pile design could be performed and the potential economical savings by rationalising the pile design could be determined.
Three 25 m long, open-ended friction piles were installed at the site. The piles had a diameter of 406.4 mm and a wall thickness of 8 mm. The load frame used for the pile testing is shown on Figure 31. It was designed to maintain a constant axial load over time with a maximum capacity of 2100 kN. The load was measured by a load cell mounted above the coil and the hydraulic cylinder with a capacity of 315 bar. Deformations were measured by a Temposonic sensor and a laser sensor.
The theoretical load capacity was about 400 kN. Load was applied as follows:
● 4 steps to 10% (40 kN) and held for 5 minutes each,
● then steps at 5% (20 kN) and held for 3 minutes,
● close to failure load was applied at 2.5% capacity (10 kN) and held for 2 minutes,
● failure was defined as a displacement of 30 mm or a creep rate > 1 mm/minute.
Some of the test results are shown on Figure 32. Pile 3, for example, was tested 1 month after installation and reloaded after 12 months (i.e. 11 months of reconsolidation). The measured pile capacity after 1 month was around 500 kN, which is close to that predicted using the Norwegian semi-empirical method. The effect of aging on the capacity of piles no. 1, 2 and 3 is shown on Figure 32. Results show an increase in pile capacity in the order of 20–50% over 12 months and this providing large potential economic savings to the development project.
Lime-cement columns are regularly use in Norway and Scandinavia to stabilise soft soils. The technique is commonly used in road and railway embankments to reduce settlements and improve the stability. At Klett, the lime—cement column trial was carried out adjacent to the piling trial as shown on Figure 1. As lime—cement columns were already planned for the area in the stabilisation of the deep road cuttings, it was logical to carry out some trials of the system to act as foundations for the two bridges.
For bridge foundations the lime cement piles are installed in a grid partly or fully covering the area for the base of the foundation, thus forming a block of wholly or partially stabilised soil. The grid and the depths of the piles is governed by the bearing capacity needed, the stability analysis and the calculations for the expected settlements. The focus of the trial was not so much into the details of the foundation method but on efforts to optimise the type and amount of binder and to study the strengths gained from field and laboratory studies for the lime cement improved soil.
Thirty-four lime cement columns were installed using standard dry mixing methods, see Figure 33. The length of the columns was 15 m with a diameter of 0.8 m. Columns were installed in a pattern forming a circle with 17 columns in each circle. Every column was installed with an overlap of 0.1 m. The columns were installed with different amount of added binders and energy used during installation.
The lime cement used for the ground improvement is a 50/50% mixture of Stabilia B40 and Norcem Standard Cement FA. Stabilia B 40 is a product of the filtered dust from waste combustion and other remote heating plants, mixed with calcium oxide (CaO).
A significant issue with respect to installation of lime—cement columns is that the process generates excess pore water pressures. This can be particularly a problem is slope stabilisation with the inherent risk of destabilising the slope. Data are shown on Figure 34 for two piezometers located approximately 7 m from the centre of the circle of lime—cement columns. The piezometers were installed at depths of 10 m and 20 m. Significant excess pore water pressures were generated especially in the 10 m piezometer. An excess spore pressure of 80 kPa was generated above the in-situ value of about 65 kPa. At 20 m the installation of the columns initially caused a reduction in the pore pressure from some 135 kPa to 115 kPa followed by the development of an excess pore pressure of about 10 kPa. Some 2 months after the installation the excess pore pressure in the 10 m piezometer had reduced to about 20 kPa but little reduction was observed in the 20 m piezometer.
In the field, several FOPS (pre-installed reverse sounding tests) and CPTU tests were carried out at different cure times. The objective of the FOPS test is to measure shear strength and homogeneity of installed piles. The FOPS probes are pressed down, to approximately 1 m below the bottom edge of the lime—cement column, after installation and before it cures. The probe is shown on Figure 33 and consists of a wing connected to a pull wire which extends through the pile up to ground level. During extraction, the force is measured continuously. The FOPS probes are 400 mm wide, have a 20 mm thick wing and the rod diameter is 36 mm. Eight tests were carried out about 6 days after column installation and an average pull out force of 36 kN was measured.
Based on the data from the field trials, it was established that a characteristic strength of 425 kPa for the stabilised silty quick clay after 2 months could be used. This value is significantly higher than what is standard practice in Norway, see NGF [66] or Vegvesen [67].
Full details of the sampling of the stabilized clay are given by [68]. The samples were obtained using Kiso-Jiban Gel Push Triple (GP-Tr) sampler. For full details of the sampler see [69] or [70]. The GP-Tr sampler is based upon a conventional rotary triple tube sampler. It includes self-adjusting shoe penetration, stationary liner and inner tubes, and an outer tube tipped with a bit that rotates and drills the soil above the shoe. The sampler uses ordinary drilling fluid to remove the cuttings and to cool the drilling bit. The drilling bit is placed above the cutting shoe, which prevents the flushing from disturbing the sample material. The difference from regular triple tube samplers is that the GP-Tr sampler uses a gel polymer to lubricate the core sample as it enters the inner tube, significantly reducing the friction between the sample and the liner tube walls. The liner tube is made of PVC-U and has an inner diameter of 83 mm and a length of 900 mm, which is the same as the sample size.
An example of an extracted sample of stabilised Klett clay is shown on Figure 35. Visually the samples look very good with no distinct signs of cracking or disturbance. The surface of the samples was smooth without any dents or damage from the sampling. However, the handling of these brittle samples required great care. The sampling method is quite time consuming since it requires extra work with mixing and loading the sampler with the gel polymer. During a normal work day of approximately 10 hours it was possible to collect 6 samples.
Laboratory testing was undertaken both on sample mixed in the laboratory and on the samples recovered using the GP-Tr process. The laboratory mixed samples were mixed with a mixture of 50% Stabilia 40 (as in the field) and 50% standard cement giving a total cement content of 90 kg/m3. Uniaxial compression tests (UC) were performed following curing for 2 days or 14 days.
The curing time for the piles at the sampling date was 120 days. It took another 30 days before the tests were completed in the laboratory. Extrusion of these samples showed that most of the samples were intact and continuous. However, some of the samples broke into several pieces during extrusion. It was necessary to trim the samples down to 72 mm in diameter so that they could fit in the testing equipment. Ideally, they should be tested at the sampled diameter of 83 mm. A series of UC tests, CAUC and CAUE triaxial tests, CRS oedometer tests and direct simple shear tests (DSS) were performed. The UC tests failed at an axial strain between 1% and 2%. This corresponds to the failure strain of laboratory mixed samples, which indicates that the sample is of good quality. Most of the triaxial tests had a larger failure strain than the uniaxial tests. Dilative behaviour of the material is considered to be the main cause of the large failure strains. The shear strength achieved from the tests varied between 60 and 310 kPa. The lowest values are caused by disturbed samples which crumbled during testing. The stabilised soil material is very brittle in nature and easy to disturb when handling and during transportation.
Full details of the installation of the lime—cement columns for the main road works are given by [71]. The method used was the Modified Dry Mixing (MDM) method as described by [72]. A total of about 48, 000 lime-cement columns corresponding to some 1, 000, 000 m of piling were installed. The clay was stabilised using columns with a diameter of 600 mm and with a 50/50 mix of lime/cement with an average binder content of about 65 kg/m3. This can be compared to the "default" content of 100 kg/m3 to 120 kg/m3 and thus represents a considerable saving. The columns were installed in a rib pattern, with an intersection between the piles of 100 mm, see Figure 36.
A large embankment was required to facilitate the construction of a bridge and a minor road over the new highway at a location north of the existing E6 as shown on Figure 1. Settlement under the embankment were carefully monitored, using settlement gauges and settlement plates, in order to avoid excessive differential settlement of the bridge. In addition, pore pressures were measured using pneumatic piezometers. A back calculation of the resulting settlements and pore pressures was carried out by Berre [73]. A summary of the measurements and the back calculation is given as follows.
The fill was constructed between 26/8/16 and 16/4/17. Pre-fabricated vertical drains were installed at 1.5 m centres on a triangular grid to some 28 m depth. The fill was about 125 m wide and 15 m thick at its highest point. The pattern of filling of the embankment was complex but detailed surveys were carried out at various stages so Berre [73] was able to implement the rate and pattern of filling accurately into his model. A cross section through the embankment together with the refined finite element mesh used in the analyses is shown on Figure 37.
Two different soil models were used to model the soft clay in the software PLAXIS namely the soft soil creep model (SSC) [74] and the unified enhanced soft clay creep model (UDSM) [75,76]. The latter model was used as SSC has some limitations in the elastic range and does not account for destructuration. Input parameters assumed are summarized on Table 2. These were obtained from a mixture of measured parameters and back calculation of laboratory triaxial and oedometer tests. Slight variations of these parameters were used to model the upper low to medium sensitive clay and the dry crust.
Type | Test type | Parameter | Physical meaning | Units | Value |
Settlement | 1D compression | e0 | Initial void ratio | ||
1D compression | λ* | Modified compression index | 0.0769 | ||
1D compression | κ* | Modified swelling index | 0.028 | ||
IL oedometer | μ* | Modified creep index | 1.96 × 10—3 | ||
1D compression | σp' — σv' (POP) | Preconsolidation stress minus vertical effective stress | kPa | 200 | |
1D compression | k | Permeability | m/s | 2 × 10—9 | |
Reconstituted 1D compression | rsi | Intrinsic creep number | 510 | ||
K0 oedometer | νur | Poisson's ratio | |||
Destructuration | Triaxial | ϕcs | Critical state friction angle | Deg. | 31 |
Triaxial | K0NC | Normally consolidated region | 0.53 | ||
Triaxial | X0 | Initial value of structure | 5 | ||
Triaxial | ϕp | Frictional angles | Deg. | 18 | |
Triaxial | g* | Compressibility parameter | 0.028 | ||
Triaxial | av | Rate of destructuration | 25.0 | ||
Triaxial | w | Destructuration control | 0.25 | ||
Triaxial | μ | Rotation of surfaces | 100 | ||
Triaxial | βkonc | Initial rotation reference surface | 0.1 | ||
Triaxial | τ | Reference time | Days | 1.0 | |
1D compression | OCRmax | Limit for creep induced OCR | 1.5 |
Modelling was carried out in a series of 18 phases mimicking the different stages of filling and unloading and allowing for the appropriate consolidation time.
Predicted versus measured settlement, at Profile 260, Sensor 9 (i.e. where fill is highest) in addition to the rate of filling is shown on Figure 38. Unfortunately, predictions are available only as far as Day 380 as Berre's work was carried out during the actual project.
The predictions are in general very good with both models giving similar output. It could be argued that the actual settlements are less than those predicted at the early stages of loading (in the clay's overconsolidated zone) and are greater than those predicted from about Day 150 when the fill reaches its maximum height (post preconsolidation stress). The rate of settlement, once the filling is complete, predicted by the models is greater than in the measurements.
Predicted and measured pore pressures at 12 m depth in Piezometer 2102 (Figure 37) close to the centre of the fill are shown on Figure 39. Unfortunately, data for Days 0 to 300 only is available. The measured pore pressures are considerably smaller than what would theoretically occur if no drains had been used.
Both models give similar results with the UDSM model performing somewhat better, especially in the early stages of loading. However, the magnitude of the measured pore pressure is much greater than the predictions between Day 145 to Day 185. This time interval corresponds to interval where the settlement curve shows greatest slope. Correspondingly, it is found that the soil passes its preconsolidation pressure from about 150 days. The measured peak pore pressure and high settlement rate may be related to this. Unfortunately, the simulations done were unable to capture this effect correctly.
Berre [73] shows how the predictions can be made to better match the measured data by alterations to the destructuration parameters X0 and av, the creep number rsi and the OCRMAX value. He also recommends that further work should be done to model the embankment behavior after Day 300, especially following the unloading.
The Norwegian Geologicial Survey (NGU) have made some interesting observations of the excavated clay [77] which may help future modelling.
This paper details the geotechnical properties of the material, especially the quick clays, found at the Klett research site near Trondheim, Norway. The importance of this site relates to the availability of detailed geotechnical information in conjunction with the results of three full scale field trials. Some conclusions from the work are as follows:
1. The site is underlain by a thick layer of relatively homogenous quick clay like that found at many other sites in Scandinavia and North America.
2. The material contains silty lenses and overall has a higher silt content that other well-known quick clay sites. The presence of the silt poses challenges for material characterisation and handling.
3. The material is highly sensitive. Classical techniques for identifying quick clay, such as rotary pressure sounding and total sounding as well as CPTU based methods work well for this site.
4. ERT and RCPTU resistivity data confirm the measurements in that much of the salt has been leached from the pore fluid. However, the resistivity data are not able to distinguish between the quick and non-quick clay. This is possibly due to the fact that the upper non-quick clay has been leached past its quick state and the sensitivity has subsequently been reduced by a continuous ion exchange process.
5. The low-plasticity sensitive clay is particularly susceptible to sample disturbance due to the high sensitivity and inhomogeneities caused by the silt layers. The mini-block sampler produced the best samples compared to the 54 mm and 75 mm piston samples.
6. Small differences in laboratory test procedures, transport, handling effects and especially time delay prior to testing affected the material properties such as peak undrained shear strength, preconsolidation stress and constrained modulus. It is therefore recommended to conduct tests as soon as possible after sampling.
7. The M0/ML sample disturbance assessment criterion for oedometer tests has shown an ability to differentiate between tests that are clearly heavily disturbed and tests that can be used for interpretation of material properties.
8. Undrained shear strength values from CAUC triaxial tests are consistent with those which would be obtained empirically from CPTU test results.
9. Small strain stiffness can be reliably defined using shear wave velocity measurements by a variety of techniques. Oedometer moduli are broadly as expected from correlations from the literature.
10. A full-scale piling trial suggests significant ageing effects can occur and present day semi-empirical design methods may result in conservative design.
11. Lime-cement column trials showed strength values greater than those which would be expected from published literature. The trial allowed for a considerable reduction in the amount of binder used compared to normal practice. Good samples of the stabilised material can be obtained using the GP-Tr gel push sampler.
12. Back-analysis of a large test fill showed very good predictions of settlement can be made using available constitutive models. Pore water pressure predictions were not as accurate. Further back-analysis work is warranted as more monitoring data has become available.
The authors are grateful to many colleagues, in the various organisations involved, for their assistance in the various aspects of this project. Rolf Sandven of Multiconsult initiated much of the research work on the site as part of the NIFS project until his untimely death in October 2016. Engineers J. Jønland, G. Winther, E. Husby and P. Østensen at NTNU are gratefully acknowledged for their skills and knowledge that made the laboratory experimental work possible. The authors wish to acknowledge support from the inter-governmental research program "Natural hazards: Infrastructure, Floods and Slides (NIFS, www.naturfare.no, 2012-2015)" as well as the OFFPHD, a program by the Research Council of Norway.
The authors declare no conflict of interest in this paper.
[1] |
Solberg IL, Rønning JS, Dalsegg E, et al. (2008) Resistivity measurements as a tool for outlining quick clay extent and valley-fill stratigraphy: a feasibility study from Buvika, central Norway. Can Geotech J 45: 210–225. doi: 10.1139/T07-089
![]() |
[2] | Emdal A, Long M, Bihs A, et al. (2012) Characterisation of Quick Clay at Dragvoll, Trondheim, Norway. Geotech Eng J SEAGS AGSSEA 43: 11–23. |
[3] |
Gylland A, Long M, Emdal A, et al. (2013) Characterisation and engineering properties of Tiller clay. Eng Geol 164: 86–100. doi: 10.1016/j.enggeo.2013.06.008
![]() |
[4] |
Solberg IL, Long M, Baranwal VC, et al. (2016) Geophysical and geotechnical studies of geology and sediment properties at a quick-clay landslide site at Esp, Trondheim, Norway. Eng Geol 208: 214–230. doi: 10.1016/j.enggeo.2016.04.031
![]() |
[5] | Helle TE, Aagaard P, Nordal S, et al. (2019) Research site Dragvoll, Trondheim, Norway-a low plasticity highly sensitive glaciomarine clay. AIMS Geosci. |
[6] | L'Heureux JS, Lindgård A, Emdal A (2019) The Tiller-Flotten research site: Geotechnical characterisation of a sensitive clay deposit. AIMS Geosci. |
[7] | Amundsen HA (2018) Storage duration effects on Norwegian low-plasticity sensitive clay samples, PhD thesis, Department of Civil and Environmental Engineering, Norwegian University of Scoence and Technology (NTNU), June. |
[8] | Tønnesen JF (1991) Gravimetri for kartlegging av løsmassemektighet i Gaulåsen (In Norwegian), 21 (211). Trondheim, Norway: Norwegian Geological Survey (NGU). |
[9] | Quinteros S, Gundersen A, L'Heureux JS, et al. (2019) Øysand research site: Geotechnical characterisation of deltaic sandy-silty soils. AIMS Geosci. |
[10] | Hafsten U (1983) Shore-level changes in South Norway during the last 13,000 years, traced by biostratigraphical methods and radiometric datings. Nor J Geogr 37: 63–97. |
[11] | Reite AJ, Selnes H, Sveian H (1982) A proposed deglaciation chronology for the Trondheimsfjord area, Central Norway. Geol Sur Nor Bull 375: 75–84. |
[12] |
Rosenqvist IT (1953) Considerations on the sensitivity of Norwegian quick clays. Géotechnique 3: 195–200. doi: 10.1680/geot.1953.3.5.195
![]() |
[13] |
Rosenqvist IT (1966) Norwegian research into the properties of quick clay: a review. Eng Geol 1: 445–450. doi: 10.1016/0013-7952(66)90020-2
![]() |
[14] | van Olphen H (1977) Clay collodial chemistry: John Wiley and Sons. |
[15] |
Torrance JK (1979) Post-depositional changes in the pore water chemistry of the sensitive marine clays of the Ottawa area, eastern Canada. Eng Geol 14: 135–147. doi: 10.1016/0013-7952(79)90081-4
![]() |
[16] | Bjerrum L, Løken T, Heiberg S (1969) A field study of factors responsible for quick clay slides. 7th International Conference on Soil Mechanics and Foundation Engineering (ICSMFE). Mexico, 531–540. |
[17] | Reite AJ (1995) Deglaciation of the Trondheimsfjord area, Central Norway. Geol Sur Nor Bull 427: 19–21. |
[18] | Reite AJ, Sveian H, Erichsen E (1999) Trohdheim fra istid til nåtid-landskaphistorie og løsmasser. Geological Survey of Norway. Gråsteinen 5, 40. |
[19] | Wolff FC (1979) Beskrivelse til de berggrunnsgeologiske kart Trondheim og Østersund. Geol Sur Nor 353: 1–76. |
[20] | Amundsen HA, Thakur V, Emdal A (2015) Comparison of two sample quality assessment methods applied to oedometer test results. In: Rinaldi VA, editor. 6th International Symposium on Deformation Characteristics of Geomaterials. Argentina: IOS Press, Argentina, 923–930. |
[21] |
Emdal A, Gylland A, Amundsen HA, et al. (2016) The mini-block sampler. Can Geotech J 53: 1235–1245. doi: 10.1139/cgj-2015-0628
![]() |
[22] | Janbu N (1970) Grunnlag i geoteknikk. Trondheim: Tapir Forlag (In Norwegian). |
[23] | Bjerrum L (1973) Problems of soil mechanics and construction on soft clays, Moscow, 111–159. |
[24] | Amundsen HA, Thakur V, Emdal A (2016) Sample disturbances in block samples of low plasticity soft clays. 17th Nordic Geotechnical Meeting, NGM 2016, Reykjavik. Reykjavik, Iceland, 159–168. |
[25] | Syversen FSG (2013) Et studie av den mineralogiske sammensetningen i norske sensitive leirer, Masteroppgave i Geofag Studieretning: Miljøgeologi og Geofarer, Institutt for Geofag Matematisk-naturvitenskaplig fakultet, Universitetet i Oslo. |
[26] | NGF (2011) Veilding for symboler og definisjoner i geoteknikk-identifisering og klassifisering av jord-Melding Nr. 2, Revidert 2011. Oslo, Norway: Norwegian Geotechnical Society (Norsk Geoteknisk Forening) (In Norwegian). |
[27] | Mitchell JK, Soga K (2005) Fundamentals of Soil Behaviour, John Wiley and Sons, Hoboken, New Jersey. |
[28] |
Leroueil S, Tavenas F, Le Bihan JP (1983) Propriétés caractéristiques des argiles d'est du Canada. Can Geotech J 20: 681–705. doi: 10.1139/t83-076
![]() |
[29] |
Burland JB (1990) On the compressibility and shear strength of natural clays. Géotechnique 40: 329–378. doi: 10.1680/geot.1990.40.3.329
![]() |
[30] | Multiconsult (2015) NIFS Natural hazards-infrastructure, floodings and slides-Detection of brittle materials. Summary report with recommendations. Multiconsult report 415559-2-RIG-RAP-004. Also published as NIFS report 27-2016. |
[31] | NGF (1989) Guideline 7. Rotary pressure soundings. Oslo: Norwegian Geotechnical Society (Norsk Geoteknisk Forening) (In Norwegian). |
[32] | NGF (1994) Guideline 9. Total soundings (under revision). Oslo: Norwegian Geotechnical Society (Norsk Geoteknisk Forening) (In Norwegian). |
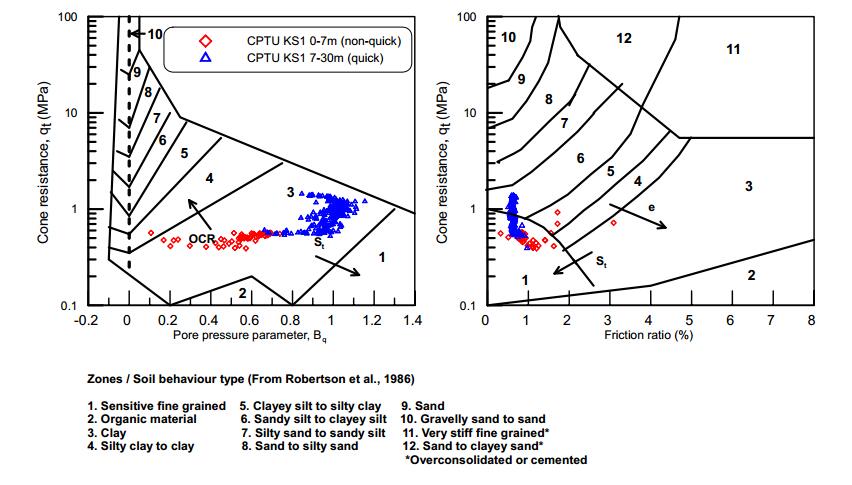
[33] | Robertson PK, Campanella RG, Gillespie D, et al. (1986) Use of piezometer cone data, Blacksburg. American Society of Engineers (ASCE), 1263–1280. |
[34] | ENISO (2012) EN ISO 22476-1: Geotechnical investigation and testing-Field testing-Part 1: Electrical cone and piezocone penetration tests. Geneva: ISO/CEN. |
[35] | Lunne T, Eidsmoen T, Gillespie D, et al. (1986) Laboratory and field evaluation of cone penetrometers, Blacksburg, 714–729. |
[36] | Lunne T, Robertson PK, Powell JJM (1997) Cone Penetration Testing in Geotechnical Practice: Blackie Academic and Professional, London. |
[37] | Lunne T, Strandvik S, Kåsin K, et al. (2018) Effect of cone penetrometer type on CPTU results at a soft clay test site in Norway. CPT18. Delft, The Netherlands. |
[38] | Lindgård A, Gundersen A, Lunne T, et al. (2018) Effect of cone type on measured CPTU results from the Tiller-Flotten quick clay test site. Geoteknikkdagen 2018. |
[39] | Sandven R, Watn A (1995) Soil classification and parameter evaluation from piezocone tests. Results from the major site investigations at Oslo Airport, Gardermoen. Theme lecture, Session 2, Interpretation of test results CPT'95. Linköping, Sweden: Swedish Geotechnical Society Report 3.95. |
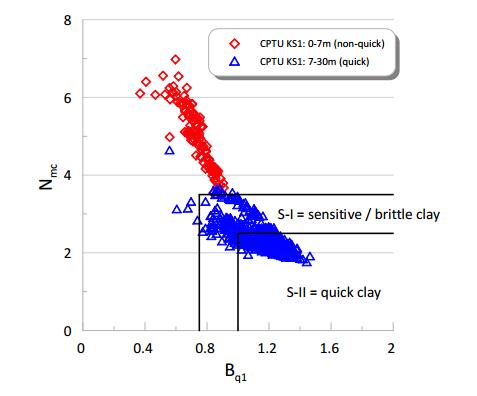
[40] | Gylland AS, Sandven R, Montafia A, et al. (2017) CPTU classification diagrams for identification of sensitive clays. In: Thakur V, L'Heureux JS, Locat A, editors. 2nd International Workshop on Landslides in Sensitive Clays (IWLSC), Chapter 5 in Landslides in Sensitive Clays, Advances in Natural and Technological Hazards Research 46. Trondheim, Norway: Springer International Publishing AG, 57–66. |
[41] | Sandven R (1990) Strength and deformation properties of fine grained soils obtained from piezocone tests. Trondheim: Norges Tekniske Høgskole (now NTNU). |
[42] |
Karlsrud K, Hernandez-Martinez FG (2013) Strength and deformation properties of Norwegian clays from laboratory tests on high-quality block samples. Can Geotech J 50: 1273–1293. doi: 10.1139/cgj-2013-0298
![]() |
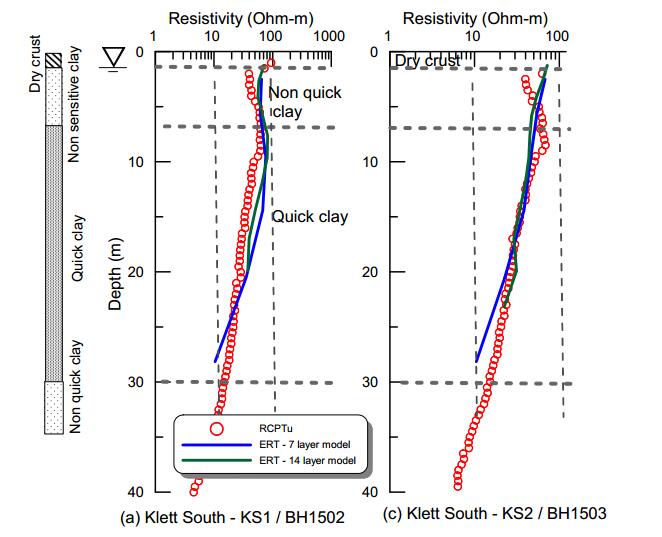
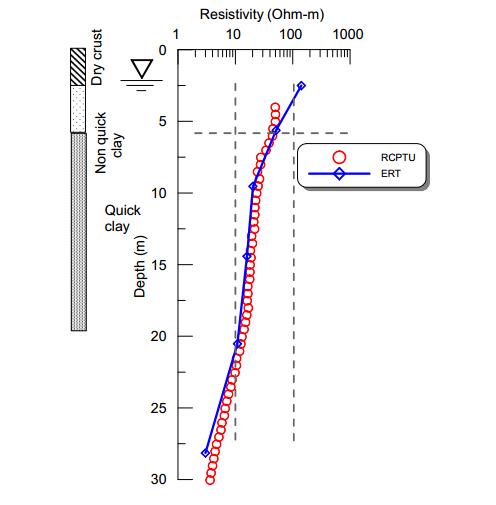
[43] | Long M, Pfaffhuber AA, Bazin S, et al. (2017) Glacio-marine clay resistivity as a proxy for remoulded shear strength: correlations and limitations. Q J Eng Geol Hydrogeol 51: 63–78. |
[44] |
Helle TE, Nordal S, Aagaard P, et al. (2016) Long term effect of potassium chloride treatment on improving the soil behaviour of highly sensitive clay Ulvensplitten, Norway. Can Geotech J 53: 410–422. doi: 10.1139/cgj-2015-0077
![]() |
[45] |
Helle TE, Aagaard P, Nordal S (2017) In situ improvement of highly sensitive clays by potassium chloride migration. J Geotech Geoenvironmental Eng 143: 04017074. doi: 10.1061/(ASCE)GT.1943-5606.0001774
![]() |
[46] | Amundsen HA, Emdal A, Sandven R, et al. (2015) On engineering characterisation of a low plasticity sensitive clay. GEOQuébec 2015-Challenges from North to South, Québec, Canada. |
[47] | Lacasse S, Berre T (1988) State-of-the-art: Triaxial testing methods for soils. In: Donaghe RT, Chaney RC, Silver ML, editors. Advanced triaxial testing of soil and rock, ASTM Special Testing Publication No 977: ASTM, 264–289. |
[48] | ASTM (2011) ASTM standard D4767-11, standard test method for consolidated undrained triaxial compression test for cohesive soils. West Conshohocken, PA: American Society of Testing Materials, 520–533. |
[49] | Andresen A, Kolstad P (1979) The NGI 54 mm samplers for undisturbed sampling of clays and representative sampling of coarser materials, Singapore, 13–21. |
[50] | Sandbaekken G, Berre T, Lacasse S (1986) Oedometer testing at the Norwegian Geotechnical Institute. In: Yong RN, Townsend FC, editors. Consolidation of Soils: Testing and Evaluation, ASTM STP 892. Philadelphia: American Society for Testing and Materials, 329–353. |
[51] | ASTM (2006) ASTM standard D4186-06, standard test method for one-dimensional consolidation properties of soils using controlled-strain loading. West Conshohocken, PA: American Society of Testing Materials, 520–533. |
[52] | Lunne T, Berre T, Strandvik S (1997) Sample disturbance in soft low plasticity Norwegian clay. In: Almeida A, editor. Symposium on Recent Developments in Soil and Pavement Mechanics. Rio de Janeiro: Balkema, Rotterdam, 81–92. |
[53] | Helle TE, Bryntesen RN, Amundsen HA, et al. (2015) Laboratory setup to evaluate the improvement of geotechnical properties from potassium chloride saturation of a quick clay from Dragvoll, Norway. GEOQuébec 2015-Challenges from North to South, Québec, Canada: Prentice-Hall Civil Engineering and Engineering Mechanics Series, Upper Saddle River, N.J.: Prentice Hall. |
[54] | Ladd CC, Lambe TW (1963) The strength of undisturbed clay determined from undrained tests. Symposium on laboratory shear testing of soil, ASTM Special Technical Publication (STP) No 361, 342–371. |
[55] | Amundsen HA, Jønland J, Emdal A, et al. (2017) An attempt to monitor pore pressure changes in a block sample during and after sampling. Géotech Lett 7. |
[56] | Amundsen HA, Thakur V (2019) Storage duration effects on soft clay samples. ASTM Geotech Test J, Submitted December 2017. |
[57] |
Long M, Donohue S (2007) In situ shear wave velocity from multichannel analysis of surface waves (MASW) tests at eight Norwegian research sites. Can Geotech J 44: 533–544. doi: 10.1139/t07-013
![]() |
[58] |
Long M, Donohue S (2010) Characterisation of Norwegian marine clays with combined shear wave velocity and CPTU data. Can Geotech J 47: 709–718. doi: 10.1139/T09-133
![]() |
[59] |
L'Heureux JS, Long M (2017) Relationship between shear wave velocity and geotechnical parameters for Norwegian clays. J Geotech Geoenvironmental Eng 143: 04017013. doi: 10.1061/(ASCE)GT.1943-5606.0001645
![]() |
[60] |
Janbu N (1985) Soil models in offshore engineering: The 25th Rankine Lecture. Géotechnique 35: 241–281. doi: 10.1680/geot.1985.35.3.241
![]() |
[61] | Ladd CC, Foott R (1974) New design procedures for the stability of soft clays. J Geotech Eng 100: 763–786. |
[62] | Ladd CC, Foott R, Ishihara K, et al. (1977) Stress-deformation and strength characteristics: State of the art report. 9th International Conference on Soil Mechanics and Foundation Engineering (ICSMFE). Tokyo, 421–494. |
[63] | Karlsrud K, Lunne T, Kort DA, et al. (2005) CPTU correlations for clays. Proceedings of the international conference on soil mechanics and geotechnical engineering, Osaka, 16: 693–702. |
[64] | Karlsrud K (2012) Prediction of load-displacement behavior and capacity of axially-loaded piles in clay based on analyses and interpretation of pile load test results, PhD thesis, Department of Civil and Environmental Engineering, NTNU, Trondheim. |
[65] | L'Heureux JS, Lunne T, Lacasse S, et al. (2016) The Norwegian Geo-Test Sites (NGTS) project-A preliminary overview. Canadian Geotechnical Conference-GeoVancouver. Vancouver, Canada. |
[66] | NGF (2012) Veiledning for grunnforsterkning med kalksementpeler. Oslo, Norway: Norwegian Geotechnical Society (Norsk Geoteknisk Forening) (In Norwegian). |
[67] | Vegvesen S (2012) Håndbok V221. Grunnforsterkning, fyllinger og skråninger, April. |
[68] | Fisvik Bache B, Lund AK (2018) Sampling of stabilised clay by use of the Kiso-Jiban GP-Tr sampler. DFI-EFFC International Conference on Deep Foundations and Ground Improvement. Rome, Italy, 100–105. |
[69] | Mori K, Sakai K (2016) The GP sampler: a new innovation in core sampling. Aust Geomech J 51: 131–166. |
[70] | Mori K, Sakai K (2016) The GP-sampler: a new innovation in core sampling. In: Lehane BM, Acosta-Martínez HE, Kelly RB, editors. 5th International Conference on Geotechnical and Geophysical Site Characterisation (ISC'5). Gold Coast, Australia: Australian Geomechanics Society, 99–124. |
[71] | Juvik ES, Solås LA, Koa IK, et al. (2019) Results from ground improvement with lime-cement columns in quick and sensitive clay on the E6 Trondheim-Melhus. XVII European Connference on Soil Mechanics and Geotechnical Engineering (ESSMGE). Reykjavik, Iceland. |
[72] | Gunther J, Holm G, Westberg G, et al. (2004) Modified dry mixing (MDM)-a new possibility in deep mixing. GeoTrans 2004: American Society of Civil Engineers, Reston, Virginia, USA, 1375–1384. |
[73] | Berre S (2017) Back calculation of the measured settlements for an instrumented fill on soft clay, Masters Thesis Geotechnical Division, Department of Civil and Transport Engineering, Norwegian University of Science and Technology (NTNU), Trondheim, Norway. |
[74] |
Stolle DFE, Vermeer PA, Bonnier PG (1999) A consolidation model for a creeping clay. Can Geotech J 36: 754–759. doi: 10.1139/t99-034
![]() |
[75] | Grimstad G, Karstunen M, Jostad HP, et al. (2017) Creep of geomaterials-some finding from the EU project CREEP. Eur J Environ Civil Eng, 16. |
[76] | Grimstad G (2016) Unified enhanced soft clay creep model-user manual and documentation. EU Creep Project, PIAG-GA-2011-286397-R4. |
[77] | Solberg IL, Hansen L (2017) Befaring av skjæringer for ny E6 ved Klett, Trondheim. Norwegian Geological Survey (NGU) Report 2017.1. |
1. | Jean-Sebastien L’Heureux, Tom Lunne, Characterization and Engineering properties of Natural Soils used for Geotesting, 2020, 6, 2471-2132, 35, 10.3934/geosci.2020004 | |
2. | Jean-Sébastien L'Heureux, Anders Lindgård, Arnfinn Emdal, The Tiller-Flotten research site: Geotechnical characterization of a very sensitive clay deposit, 2019, 5, 2471-2132, 831, 10.3934/geosci.2019.4.831 | |
3. | Paul W. Mayne, Jean Benoît, Analytical CPTU Models Applied to Sensitive Clay at Dover, New Hampshire, 2020, 146, 1090-0241, 04020130, 10.1061/(ASCE)GT.1943-5606.0002378 | |
4. | T B Kurniawan, F Usman, R C Omar, K A Sanusi, Preference system for guided the selection of improvement type and assessment of soil based on expert opinion with weighted system, 2021, 708, 1755-1307, 012018, 10.1088/1755-1315/708/1/012018 | |
5. | C H Yan, P Paniagua, B K F Bache, S Lacasse, Observations from Reverse Column Penetration Tests (RCP) on Lime-cement Columns in Klett, Trondheim, Norway, 2021, 710, 1755-1307, 012051, 10.1088/1755-1315/710/1/012051 | |
6. | P Paniagua, B K F Bache, A K Lund, K Karlsrud, Full-scale field-testing of lime-cement columns in a very sensitive clay, 2021, 710, 1755-1307, 012049, 10.1088/1755-1315/710/1/012049 | |
7. | Priscilla Paniagua, Bjørn Kristian Bache, Kjell Karlsrud, Alf Kristian Lund, Strength and stiffness of laboratory-mixed specimens of stabilised Norwegian clays, 2022, 175, 1755-0750, 150, 10.1680/jgrim.19.00051 | |
8. | Bjørn Kristian Fiskvik Bache, Pernille Wiersholm, Priscilla Paniagua, Arnfinn Emdal, Effect of Temperature on the Strength of Lime–Cement Stabilized Norwegian Clays, 2022, 148, 1090-0241, 10.1061/(ASCE)GT.1943-5606.0002699 | |
9. | Christian Strømme Ofstad, Kjell Karlsrud, Sølve Hov, Thi Minh Hue Le, Jean-Sébastien L’Heureux, 2025, Chapter 27, 978-981-97-8220-8, 277, 10.1007/978-981-97-8221-5_27 | |
10. | Papadopoulou Myrto, Malehmir Alireza, Markovic Magdalena, Berglund Johan, High‐resolution P‐ and S‐wavefield seismic investigations of a quick‐clay site in southwest of Sweden, 2023, 21, 1569-4445, 458, 10.1002/nsg.12269 | |
11. | Priscilla Paniagua, Sølve Hov, Ali Amiri, Stefan Ritter, Recent Norwegian research on stabilisation of soft clays with the Dry Deep Mixing method, 2024, 11, 2188-8027, 135, 10.3208/jgssp.vol11.DS-1-08 |
Minerals | Bulk fraction | Clay sized fraction | |||
Sample 100 Approx. (%) | Sample 101 Approx. (%) | Sample 100 (%) | Sample 101 (%) | ||
Chlorite | 23.2 | 22.5 | 22.9 | 24.9 | |
Illite | 58.3 | 62.4 | 77.0 | 75.0 | |
Amphibolite | 1.2 | 0.9 | |||
Quartz | 8.7 | 6.1 | |||
Microline | 5.6 | 2.9 | |||
Plagioclase | 3.1 | 5.3 | |||
Feltspar | 8.7 | 8.1 |
Type | Test type | Parameter | Physical meaning | Units | Value |
Settlement | 1D compression | e0 | Initial void ratio | ||
1D compression | λ* | Modified compression index | 0.0769 | ||
1D compression | κ* | Modified swelling index | 0.028 | ||
IL oedometer | μ* | Modified creep index | 1.96 × 10—3 | ||
1D compression | σp' — σv' (POP) | Preconsolidation stress minus vertical effective stress | kPa | 200 | |
1D compression | k | Permeability | m/s | 2 × 10—9 | |
Reconstituted 1D compression | rsi | Intrinsic creep number | 510 | ||
K0 oedometer | νur | Poisson's ratio | |||
Destructuration | Triaxial | ϕcs | Critical state friction angle | Deg. | 31 |
Triaxial | K0NC | Normally consolidated region | 0.53 | ||
Triaxial | X0 | Initial value of structure | 5 | ||
Triaxial | ϕp | Frictional angles | Deg. | 18 | |
Triaxial | g* | Compressibility parameter | 0.028 | ||
Triaxial | av | Rate of destructuration | 25.0 | ||
Triaxial | w | Destructuration control | 0.25 | ||
Triaxial | μ | Rotation of surfaces | 100 | ||
Triaxial | βkonc | Initial rotation reference surface | 0.1 | ||
Triaxial | τ | Reference time | Days | 1.0 | |
1D compression | OCRmax | Limit for creep induced OCR | 1.5 |