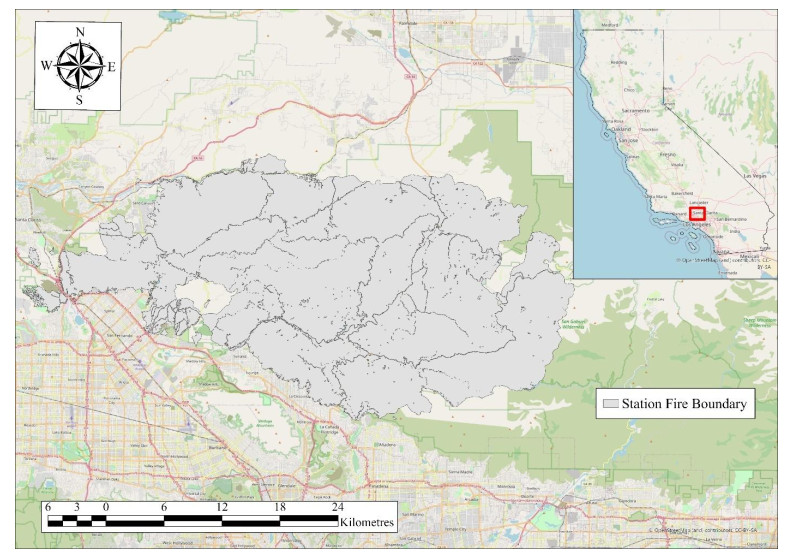
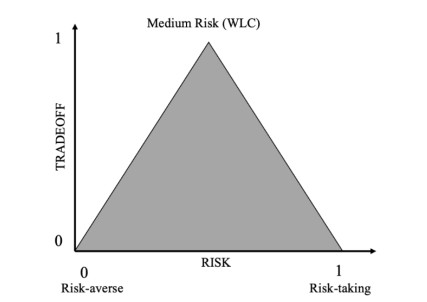
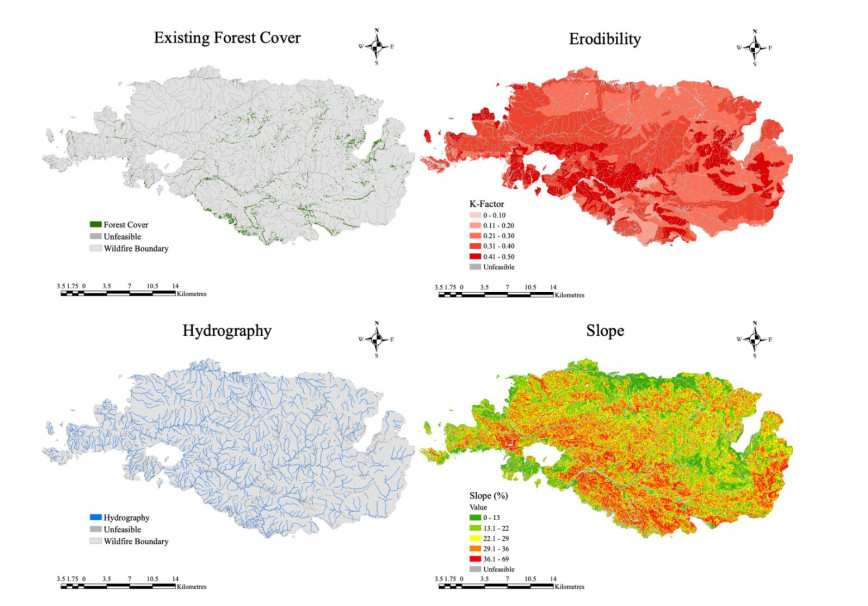
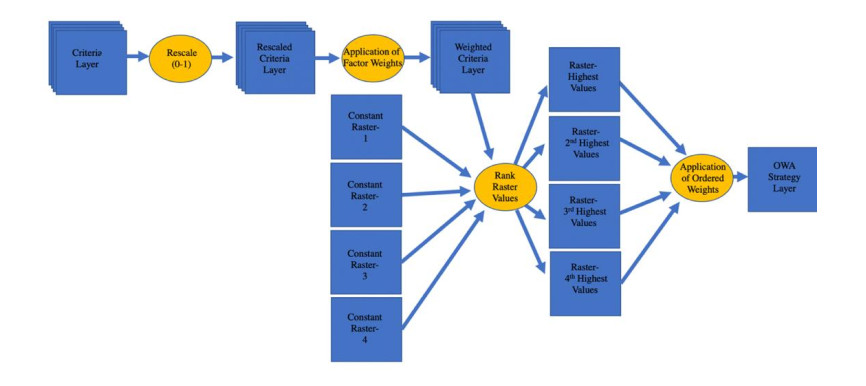
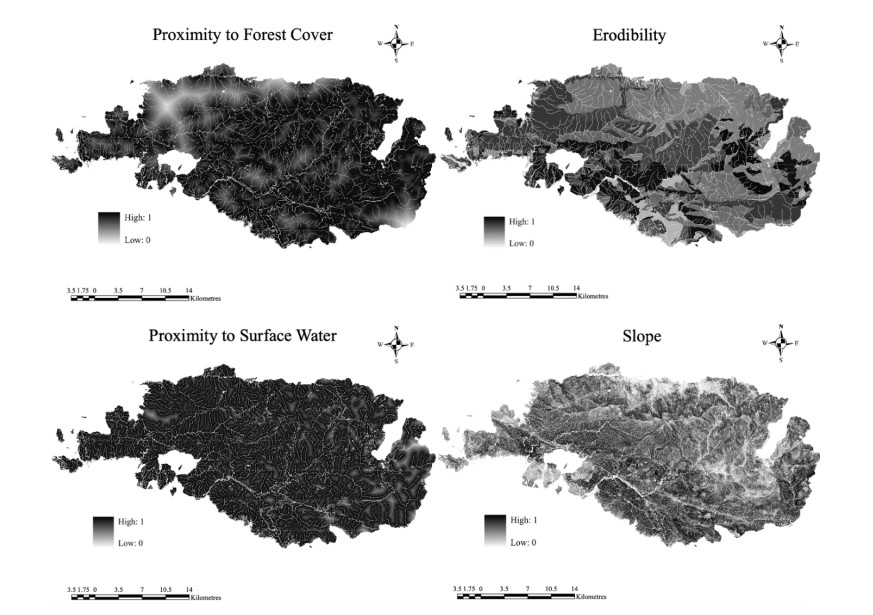
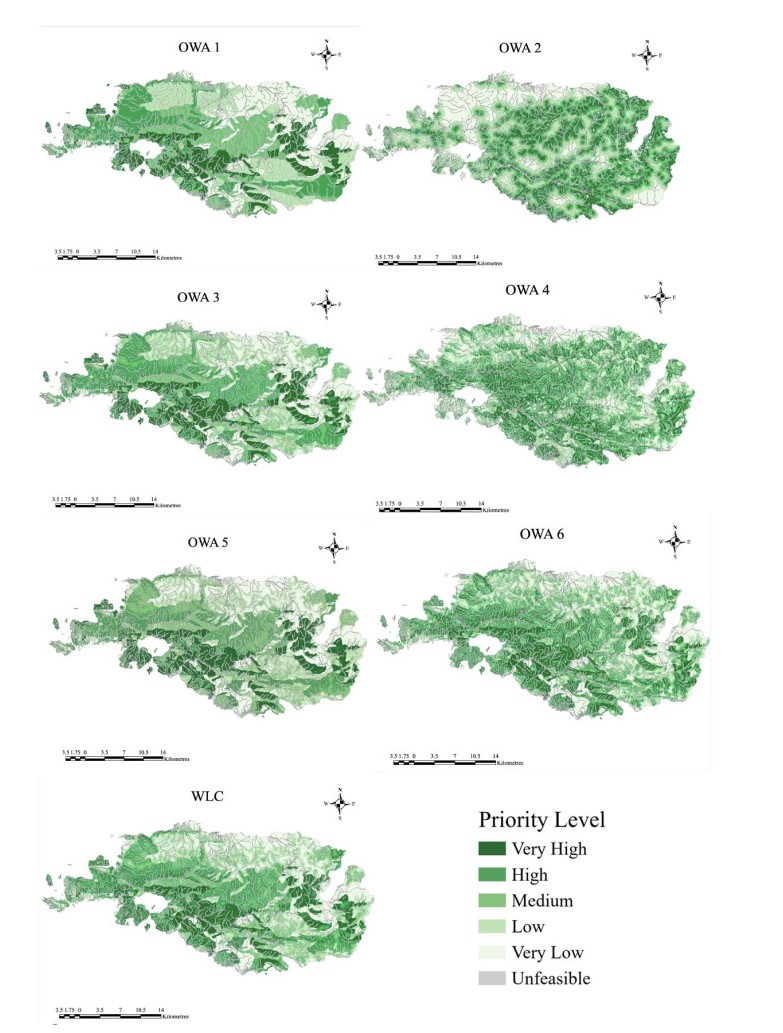
Wildfires are a prevalent natural disaster that can significantly impact human populations and result in considerable losses. With a changing climate, wildfires in many countries have increased in intensity and frequency, making effective restoration efforts in affected areas crucial. This paper aims to evaluate the efficacy of ordered weighted averaging (OWA), a GIS-based multi-criteria decision analysis technique, in identifying priority areas for wildfire restoration. A case study using the 2009 Station Fire in California is presented, using the restoration criteria of slope, erodibility, proximity to forest cover, and proximity to surface water. By applying both importance and order weights, multiple OWA decision strategies with varying risk levels were examined. Different strategies greatly influence the spatial distribution of land considered high and low priority for wildfire restoration, each with varying levels of trade off. In the OWA decision space, placing full emphasis on the highest (best) values (using the risk-taking OR operator) or the lowest values (using the risk-averse AND operator) resulted in composite priority maps that cannot be recommended for practical use. More nuanced scenarios are achieved with the OWA operators representing a range of compromise decision strategies between these extremes. The OWA technique in GIS can thus help to explore the impact of decision-makers' risk attitudes in a wildfire restoration setting.
Citation: Tanner Noth, Claus Rinner. Prioritization in wildfire restoration using GIS-based ordered weighted averaging (OWA): A case study in southern California[J]. AIMS Environmental Science, 2021, 8(5): 481-497. doi: 10.3934/environsci.2021031
Wildfires are a prevalent natural disaster that can significantly impact human populations and result in considerable losses. With a changing climate, wildfires in many countries have increased in intensity and frequency, making effective restoration efforts in affected areas crucial. This paper aims to evaluate the efficacy of ordered weighted averaging (OWA), a GIS-based multi-criteria decision analysis technique, in identifying priority areas for wildfire restoration. A case study using the 2009 Station Fire in California is presented, using the restoration criteria of slope, erodibility, proximity to forest cover, and proximity to surface water. By applying both importance and order weights, multiple OWA decision strategies with varying risk levels were examined. Different strategies greatly influence the spatial distribution of land considered high and low priority for wildfire restoration, each with varying levels of trade off. In the OWA decision space, placing full emphasis on the highest (best) values (using the risk-taking OR operator) or the lowest values (using the risk-averse AND operator) resulted in composite priority maps that cannot be recommended for practical use. More nuanced scenarios are achieved with the OWA operators representing a range of compromise decision strategies between these extremes. The OWA technique in GIS can thus help to explore the impact of decision-makers' risk attitudes in a wildfire restoration setting.

| [1] |
Patricola CM, Wehner MF (2018) Anthropogenic influences on major tropical cyclone events. Nature 563: 339-346. doi: 10.1038/s41586-018-0673-2

|
| [2] |
Maina FZ, Siirila-Woodburn ER (2020) Watersheds dynamics following wildfires: Nonlinear feedbacks and implications on hydrologic responses. Hydrol Process 34: 33-50. doi: 10.1002/hyp.13568
|
| [3] |
Hoeppe P (2016) Trends in weather related disasters - Consequences for insurers and society. Weather Clim Extrem 11: 70-79. doi: 10.1016/j.wace.2015.10.002
|
| [4] |
Domínguez D, Yeh C (2020) Social justice disaster relief, counseling, and advocacy: the case of the Northern California wildfires. Couns Psychol Q 33: 287-311. doi: 10.1080/09515070.2018.1542593
|
| [5] |
Huffman DW, Roccaforte JP, Springer JD, et al. (2020) Restoration applications of resource objective wildfires in western US forests: a status of knowledge review. Fire Ecol 16: 18. doi: 10.1186/s42408-020-00077-x
|
| [6] |
Guerrero AM, Shoo L, Iacona G, et al. (2017) Using structured decision-making to set restoration objectives when multiple values and preferences exist. Restor Ecol 25: 858-865. doi: 10.1111/rec.12591
|
| [7] |
Neeson TM, Smith SDP, Allan JD, et al. (2016) Prioritizing ecological restoration among sites in multi-stressor landscapes. Ecol Appl 26: 1785-1796. doi: 10.1890/15-0948.1
|
| [8] | Malczewski J, Rinner C (2015) Multicriteria Decision Analysis in Geographic Information Science. Berlin/Heidelberg: Springer-Verlag. |
| [9] | Argyriou AV., Teeuw RM, Rust D, et al. (2016) GIS multi-criteria decision analysis for assessment and mapping of neotectonic landscape deformation: A case study from Crete. Geomorphology 253: 262-274. |
| [10] |
Feizizadeh B, Blaschke T (2014) An uncertainty and sensitivity analysis approach for GIS-based multicriteria landslide susceptibility mapping. Int J Geogr Inf Sci 28: 610-638. doi: 10.1080/13658816.2013.869821
|
| [11] |
Ahmed B (2015) Landslide susceptibility mapping using multi-criteria evaluation techniques in Chittagong Metropolitan Area, Bangladesh. Landslides 12: 1077-1095. doi: 10.1007/s10346-014-0521-x
|
| [12] |
Alvarado A, Esteller MV, Quentin E, et al. (2016) Multi-Criteria Decision Analysis and GIS Approach for Prioritization of Drinking Water Utilities Protection Based on their Vulnerability to Contamination. Water Resour Manag 30: 1549-1566. doi: 10.1007/s11269-016-1239-4
|
| [13] |
Jhariya DC, Kumar T, Pandey HK (2020) Watershed prioritization based on soil and water hazard model using remote sensing, geographical information system and multi-criteria decision analysis approach. Geocarto Int 35: 188-208. doi: 10.1080/10106049.2018.1510039
|
| [14] |
Silva TCM, Vieira ICG (2020) Identification of priority areas for ecological restoration in Eastern Para, Brazil. Floresta e Ambient 27: e20180144. doi: 10.1590/2179-8087.014418
|
| [15] |
Borrelle SB, Buxton RT, Jones HP, et al. (2015) A GIS-based decision-making approach for prioritizing seabird management following predator eradication. Restor Ecol 23: 580-587. doi: 10.1111/rec.12229
|
| [16] |
Faramarzi H, Hosseini SM, Pourghasemi HR, et al. (2021) Forest fire spatial modelling using ordered weighted averaging multi-criteria evaluation. J For Sci 67: 87-100. doi: 10.17221/50/2020-JFS
|
| [17] |
Xiao Y, Yi S, Tang Z (2017) Integrated flood hazard assessment based on spatial ordered weighted averaging method considering spatial heterogeneity of risk preference. Sci Total Environ 599-600: 1034-1046. doi: 10.1016/j.scitotenv.2017.04.218
|
| [18] |
Halme P, Allen KA, Auniņš A, et al. (2013) Challenges of ecological restoration: Lessons from forests in northern Europe. Biol Conserv 167: 248-256. doi: 10.1016/j.biocon.2013.08.029
|
| [19] |
Valente RA, Petean FC de S, Vettorazzi CA (2017) Multicriteria decision analysis for prioritizing areas for forest restoration. Cerne 23: 1. doi: 10.1590/01047760201723012258
|
| [20] |
Vogler KC, Ager AA, Day MA, et al. (2015) Prioritization of forest restoration projects: Tradeoffs between wildfire protection, ecological restoration and economic objectives. Forests 6: 4403-4420. doi: 10.3390/f6124375
|
| [21] |
Ager AA, Barros AMG, Houtman R, et al. (2020) Modelling the effect of accelerated forest management on long-term wildfire activity. Ecol Modell 421: 108962. doi: 10.1016/j.ecolmodel.2020.108962
|
| [22] |
Ana AM, Ager AA, Day MA, et al. (2019) Improving long-term fuel treatment effectiveness in the National Forest System through quantitative prioritization. For Ecol Manage 433: 514-527. doi: 10.1016/j.foreco.2018.10.041
|
| [23] |
Lopes TR, Moura LB, Nasimento JG, et al. (2020) Priority areas for forest restoration aiming at the maintenance of water resources in a basin in the Cerrado/Amazon ecotone, Brazil. J South Am Earth Sci 101: 102630. doi: 10.1016/j.jsames.2020.102630
|
| [24] |
Paveglio TB, Kooistra C, Hall T, et al. (2016) Understanding the effect of large wildfires on residents' well-being: What factors influence wildfire impact. For Sci 62: 59-69. doi: 10.5849/forsci.15-021
|
| [25] |
Burton CA, Hoefen TM, Plumlee GS, et al. (2016) Trace Elements in Stormflow, Ash, and Burned Soil following the 2009 Station Fire in Southern California. PLoS One 11: e0153372. doi: 10.1371/journal.pone.0153372
|
| [26] | Thompson R, Kaplan C, Gomberg D (2009) The Station Fire : An Example of a Large Wildfire in the Absence of Significant Winds. Available online at https://www.weather.gov/media/wrh/online_publications/talite/talite1002-1.pdf |
| [27] |
Syphard AD, Radeloff VC, Keeley JE, et al. (2007) Human influence on California fire regimes. Ecol Appl 17: 1388-1402. doi: 10.1890/06-1128.1
|
| [28] |
Wegesser TC, Pinkerton KE, Last JA (2009) California wildfires of 2008: Coarse and fine particulate matter toxicity. Environ Health Perspect 117: 893-897. doi: 10.1289/ehp.0800166
|
| [29] |
Stein ED, Brown JS, Hogue TS, et al. (2012) Stormwater contaminant loading following southern California wildfires. Environ Toxicol Chem 31: 2625-2638. doi: 10.1002/etc.1994
|
| [30] | Liu T, McGuire LA, Wei H, et al. (2021) The timing and magnitude of changes to Hortonian overland flow at the watershed scale during the post-fire recovery process. Hydrol Process 35: e14208. |
| [31] | Liu QQ, Chen L, Li JC (2001) Influences of slope gradient on soil erosion. Appl Math Mech 22: 510-519. |
| [32] |
Schmidt S, Ballabio C, Alewell C, et al. (2018) Filling the European blank spot—Swiss soil erodibility assessment with topsoil samples. J Plant Nutr Soil Sci 181: 737-748. doi: 10.1002/jpln.201800128
|
| [33] |
Lind L, Hasselquist EM, Laudon H (2019) Towards ecologically functional riparian zones: A meta-analysis to develop guidelines for protecting ecosystem functions and biodiversity in agricultural landscapes. J Environ Manage 249: 109391. doi: 10.1016/j.jenvman.2019.109391
|
| [34] |
Jiang H, Eastman JR (2000) Application of fuzzy measures in multi-criteria evaluation in GIS. Int J Geogr Inf Sci 14: 173-184. doi: 10.1080/136588100240903
|
| [35] | Eastman JR, Kyem P, Toledano J, et al. (1993) GIS and decision making. Photogramm Eng Rem S 61: 539-547 |
| [36] |
Malczewski J (2000) On the use of weighted linear combination method in GIS: Common and best practice approaches. Trans GIS 4: 5-22. doi: 10.1111/1467-9671.00035
|
| [37] |
Saaty TL (1987) Decision making with the analytic hierarchy process. Omega 15: 283-290. doi: 10.1016/0305-0483(87)90016-8
|
| [38] |
Malczewski J, Chapman T, Flegel C, et al. (2003) GIS multicriteria evaluation with ordered weighted averaging (OWA): Case study of developing watershed management strategies. Environ Plan A 35: 1769-1784. doi: 10.1068/a35156
|
| [39] |
Uribe D, Geneletti D, del Castillo RF, et al. (2014) Integrating stakeholder preferences and GIS-based multicriteria analysis to identify forest landscape restoration priorities. Sustain 6: 935-951. doi: 10.3390/su6020935
|
| [40] |
Vettorazzi CA, Valente RA (2016) Priority areas for forest restoration aiming at the conservation of water resources. Ecol Eng 94: 255-267. doi: 10.1016/j.ecoleng.2016.05.069
|
Figures(6) / Tables(4)

Tanner Noth, Claus Rinner. Prioritization in wildfire restoration using GIS-based ordered weighted averaging (OWA): A case study in southern California[J]. AIMS Environmental Science, 2021, 8(5): 481-497. doi: 10.3934/environsci.2021031


 DownLoad: