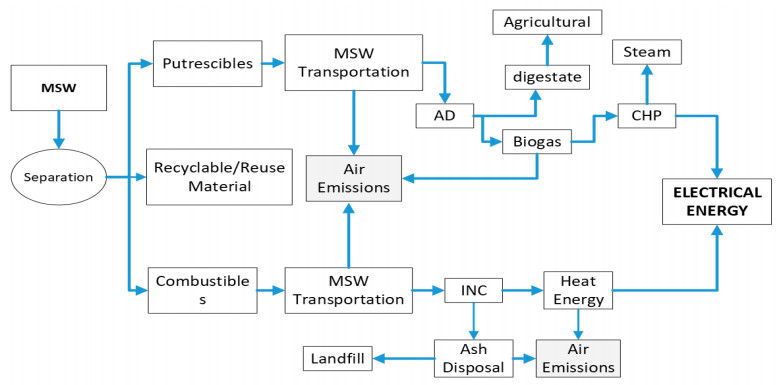
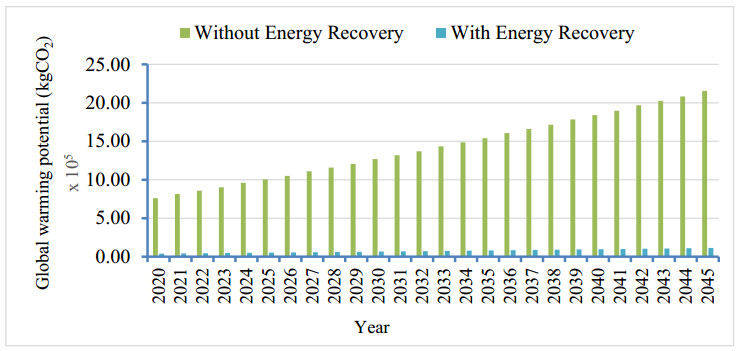
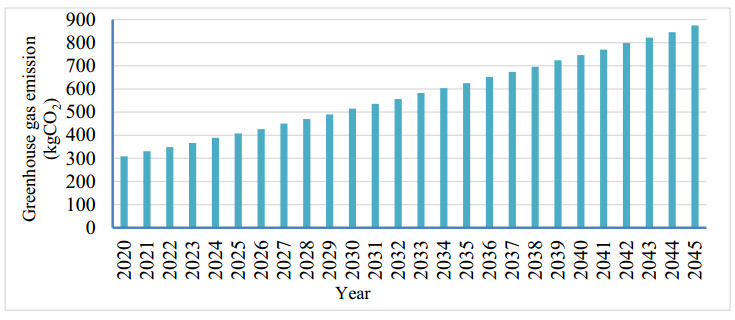
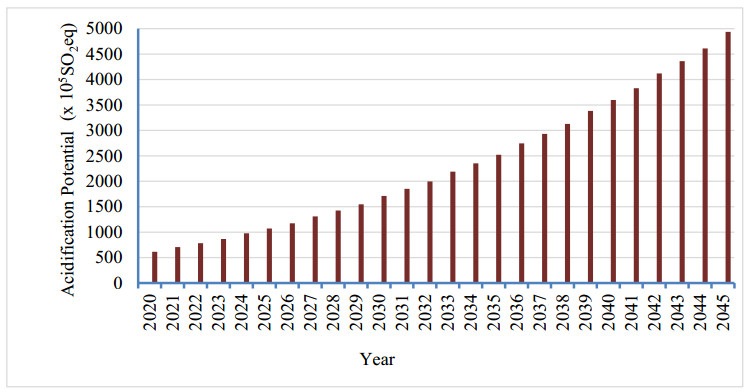
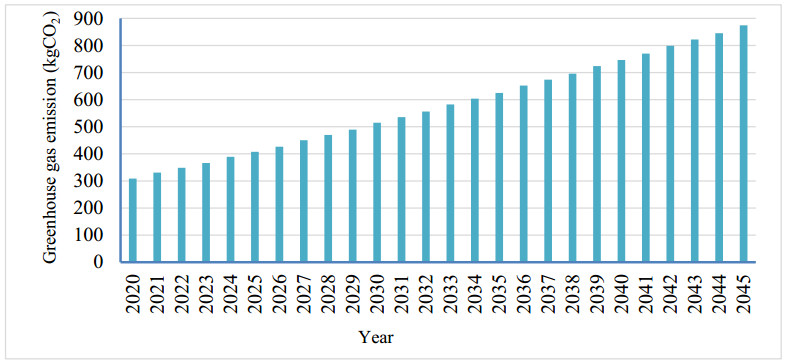
This study examined the potential of electricity generation from biogas and heat energy arising from municipal solid waste (MSW) collected from the year 2021 to 2045 using anaerobic digestion (AD) and incineration (INC) technologies. The goal of this paper is to evaluate the economic and environmental benefits of implementing the aforementioned technologies in Lesotho. The environmental impact was assessed by using the life cycle assessment strategy based on global warming potential for three scenarios, while the economic assessment was carried out by using the net present value (NPV), levelized cost of energy (LCOE) and total life cycle cost. The key findings show that, over 25 years (2021–2045), MSW generation will range from 185.855 to 513.587 kilotons. The methane yield for the duration of the project for AD technology is 44.67–126.56 thousand cubic meters per year. Moreover, the electricity generation will range from 0.336–0.887 GWh for AD technology and 17.15–45.34 GWh for INC technology. Economically, the results demonstrated that the two waste-to-energy technologies are viable, as evidenced by their positive NPV. The NPV for AD was about USD 0.514 million, and that for INC technology was USD 339.65 million. AD and INC have LCOEs of 0.029 and 0.0023 USD/kWh, respectively. The findings demonstrate that AD can minimize the potential for global warming by 95%, signifying a huge environmental advantage. This paper serves to provide the government, as well as the investors, with current and trustworthy information on waste-to-energy technologies in terms of costs, execution and worldwide effect, which could aid optimal decision-making in waste-to-energy projects in Lesotho.
Citation: Tsepo Sechoala, Olawale Popoola, Temitope Ayodele. Economic and environmental assessment of electricity generation using biogas and heat energy from municipal solid waste: A case study of Lesotho[J]. AIMS Energy, 2023, 11(2): 337-357. doi: 10.3934/energy.2023018
This study examined the potential of electricity generation from biogas and heat energy arising from municipal solid waste (MSW) collected from the year 2021 to 2045 using anaerobic digestion (AD) and incineration (INC) technologies. The goal of this paper is to evaluate the economic and environmental benefits of implementing the aforementioned technologies in Lesotho. The environmental impact was assessed by using the life cycle assessment strategy based on global warming potential for three scenarios, while the economic assessment was carried out by using the net present value (NPV), levelized cost of energy (LCOE) and total life cycle cost. The key findings show that, over 25 years (2021–2045), MSW generation will range from 185.855 to 513.587 kilotons. The methane yield for the duration of the project for AD technology is 44.67–126.56 thousand cubic meters per year. Moreover, the electricity generation will range from 0.336–0.887 GWh for AD technology and 17.15–45.34 GWh for INC technology. Economically, the results demonstrated that the two waste-to-energy technologies are viable, as evidenced by their positive NPV. The NPV for AD was about USD 0.514 million, and that for INC technology was USD 339.65 million. AD and INC have LCOEs of 0.029 and 0.0023 USD/kWh, respectively. The findings demonstrate that AD can minimize the potential for global warming by 95%, signifying a huge environmental advantage. This paper serves to provide the government, as well as the investors, with current and trustworthy information on waste-to-energy technologies in terms of costs, execution and worldwide effect, which could aid optimal decision-making in waste-to-energy projects in Lesotho.

| [1] |
Carlsson Reich M (2005) Economic assessment of municipal waste management systems—case studies using a combination of life cycle assessment (LCA) and life cycle costing (LCC). J Cleaner Prod 13: 253–263. https://doi.org/10.1016/j.jclepro.2004.02.015 doi: 10.1016/j.jclepro.2004.02.015

|
| [2] | Nguyen PH, Nguyen Cao QK, Bui LT (2022) Energy recovery from municipal solid waste landfill for a sustainable circular economy in Danang City, Vietnam. IOP Conference Series: Earth Environ Sci 964: 012015. https://doi.org/10.1088/1755-1315/964/1/012015 |
| [3] |
Cudjoe D, Han MS (2021) Economic feasibility and environmental impact analysis of landfill gas to energy technology in African urban areas. J Cleaner Prod 284: 125437. https://doi.org/10.1016/j.jclepro.2020.125437 doi: 10.1016/j.jclepro.2020.125437
|
| [4] | Mvuma G (2010) Waste a necessary evil for economically impoverished communities in least developed countries (LCDc): a case study. Available from: https://researchspace.csir.co.za/dspace/handle/10204/4531. |
| [5] | Thamae M, Molapo K, Koaleli M, et al. (2006) The baseline assessment for the development of an Integrated Solid Waste Management System (ISWMS) for Maseru City. Lesotho2006. Available from: https://info.undp.org/docs/pdc/Documents/LSO/00058398_PPP-ISWM%20Prodoc.pdf. |
| [6] | Hoornweg D, Bhada-Tata P (2012) What a waste: a global review of solid waste management. Available from: https://openknowledge.worldbank.org/handle/10986/17388. |
| [7] |
Ayodele TR, Ogunjuyigbe ASO, Alao MA (2017) Life cycle assessment of waste-to-energy (WtE) technologies for electricity generation using municipal solid waste in Nigeria. Appl Energy 201: 200–218. https://doi.org/10.1016/j.apenergy.2017.05.097 doi: 10.1016/j.apenergy.2017.05.097
|
| [8] | Independent Group of Scientists (2019) The Future is Now: Science for Achieving Sustainable Development. New York: United Nations. Available from: https://sustainabledevelopment.un.org/content/documents/24797GSDR_report_2019.pdf. |
| [9] |
Johari A, Ahmed SI, Hashim H, et al. (2012) Economic and environmental benefits of landfill gas from municipal solid waste in Malaysia. Renewable Sustainable Energy Rev 16: 2907–2912. https://doi.org/10.1016/j.rser.2012.02.005 doi: 10.1016/j.rser.2012.02.005
|
| [10] |
Shin HC, Park JW, Kim HS, et al. (2005) Environmental and economic assessment of landfill gas electricity generation in Korea using LEAP model. Energy Policy 33: 1261–1270. https://doi.org/10.1016/j.enpol.2003.12.002 doi: 10.1016/j.enpol.2003.12.002
|
| [11] | Sechoala TD, Popoola OM, Ayodele TR (2019) A review of waste-to-energy recovery pathway for feasible electricity generation in lowland cities of Lesotho. IEEE, 1–5. https://doi.org/10.1109/AFRICON46755.2019.9133756 |
| [12] |
Scarlat N, Motola V, Dallemand JF, et al. (2015) Evaluation of energy potential of municipal solid waste from African urban areas. Renewable Sustainable Energy Rev 50: 1269–1286. https://doi.org/10.1016/j.rser.2015.05.067 doi: 10.1016/j.rser.2015.05.067
|
| [13] |
Cudjoe D, Acquah PM (2021) Environmental impact analysis of municipal solid waste incineration in African countries. Chemosphere 265: 129186. https://doi.org/10.1016/j.chemosphere.2020.129186 doi: 10.1016/j.chemosphere.2020.129186
|
| [14] |
Silva LJ de VB da, dos Santos IFS, Mensah JHR, et al. (2020) Incineration of municipal solid waste in Brazil: An analysis of the economically viable energy potential. Renewable Energy 149: 1386–1394. https://doi.org/10.1016/j.renene.2019.10.134 doi: 10.1016/j.renene.2019.10.134
|
| [15] | China Statistical Yearbook (2015) China Statistical Yearbook 2014. NBSC Beijing. Available from: http://www.stats.gov.cn/sj/ndsj/2014/indexeh.htm. |
| [16] |
Damgaard A, Riber C, Fruergaard T, et al. (2010) Life-cycle-assessment of the historical development of air pollution control and energy recovery in waste incineration. Waste Manage 30: 1244–1250. https://doi.org/10.1016/j.wasman.2010.03.025 doi: 10.1016/j.wasman.2010.03.025
|
| [17] |
de Souza Ribeiro N, Barros RM, dos Santos IFS, et al. (2021) Electric energy generation from biogas derived from municipal solid waste using two systems: Landfills and anaerobic digesters in the states of Sao Paulo and Minas Gerais, Brazil. Sustainable Energy Technol Assess 48: 101552. https://doi.org/10.1016/j.seta.2021.101552 doi: 10.1016/j.seta.2021.101552
|
| [18] |
El Ibrahimi M, Khay I, El Maakoul A, et al. (2021) Techno-economic and environmental assessment of anaerobic co-digestion plants under different energy scenarios: A case study in Morocco. Energy Convers Manage 245: 114553. https://doi.org/10.1016/j.enconman.2021.114553 doi: 10.1016/j.enconman.2021.114553
|
| [19] |
Cudjoe D, Han MS, Nandiwardhana AP (2020) Electricity generation using biogas from organic fraction of municipal solid waste generated in provinces of China: Techno-economic and environmental impact analysis. Fuel Process Technol 203: 106381. https://doi.org/10.1016/j.fuproc.2020.106381 doi: 10.1016/j.fuproc.2020.106381
|
| [20] | Tyagi VK, Fdez-Güelfo LA, Zhou Y, et al. (2018) Anaerobic co-digestion of organic fraction of municipal solid waste (OFMSW): Progress and challenges. Renewable Sustainable Energy Rev. https://doi.org/10.1016/j.rser.2018.05.051 |
| [21] |
Hapazari I, Ntuli V, Taele B (2015) Waste generation and management in lesotho and waste to clay brick recycling a review. Curr J Appl Sci Technol 8: 148–161. https://doi.org/10.9734/BJAST/2015/11224 doi: 10.9734/BJAST/2015/11224
|
| [22] | Sechoala TD, Popoola OM, Ayodele TR (2020) Projection of electricity potential through exploitation of methane gas from landfilled MSW of Lesotho. IEEE, 1–5. https://doi.org/10.1109/PowerAfrica49420.2020.9219870 |
| [23] | Sechoala TD, Popoola OM, Ayodele TR (2021) Potential of electricity generation through anaerobic digestion and incineration technology for selected districts in Lesotho. IEEE, 1–7. https://doi.org/10.1109/SAUPEC/RobMech/PRASA52254.2021.9377211 |
| [24] |
Adenuga OT, Mpofu K, Modise KR (2020) An approach for enhancing optimal resource recovery from different classes of waste in South Africa: Selection of appropriate waste to energy technology. Sustainable Futures 2: 100033. https://doi.org/10.1016/j.sftr.2020.100033 doi: 10.1016/j.sftr.2020.100033
|
| [25] |
Ayodele TR, Alao MA, Ogunjuyigbe ASO (2020) Effect of collection efficiency and oxidation factor on greenhouse gas emission and life cycle cost of landfill distributed energy generation. Sustainable Cities Soc 52: 101821. https://doi.org/10.1016/j.scs.2019.101821 doi: 10.1016/j.scs.2019.101821
|
| [26] |
Ayodele TR, Ogunjuyigbe ASO, Amusan TO (2018) Techno-economic analysis of utilizing wind energy for water pumping in some selected communities of Oyo State, Nigeria. Renewable Sustainable Energy Rev 91: 335–343. https://doi.org/10.1016/j.rser.2018.03.026 doi: 10.1016/j.rser.2018.03.026
|
| [27] |
Ayodele TR, Alao MA, Ogunjuyigbe ASO (2018) Recyclable resources from municipal solid waste: Assessment of its energy, economic and environmental benefits in Nigeria. Resour, Conserv Recycl 134: 165–173. https://doi.org/10.1016/j.resconrec.2018.03.017 doi: 10.1016/j.resconrec.2018.03.017
|
| [28] | Bureau of Statistics (2016) 2016 Lesotho Population Census. Maseru Lesotho: Ministry of Development Planning. Available from: https://searchworks.stanford.edu/view/13170410. |
| [29] |
Alao MA, Popoola OM, Ayodele TR (2021) Selection of waste-to-energy technology for distributed generation using IDOCRIW-Weighted TOPSIS method: A case study of the City of Johannesburg, South Africa. Renewable Energy 178: 162–183. https://doi.org/10.1016/j.renene.2021.06.031 doi: 10.1016/j.renene.2021.06.031
|
| [30] |
Ryu C (2010) Potential of municipal solid waste for renewable energy production and reduction of greenhouse gas emissions in South Korea. J Air Waste Manage Assoc 60: 176–183. https://doi.org/10.3155/1047-3289.60.2.176 doi: 10.3155/1047-3289.60.2.176
|
| [31] |
Ogunjuyigbe A, Ayodele T, Alao M (2017) Electricity generation from municipal solid waste in some selected cities of Nigeria: An assessment of feasibility, potential and technologies. Renewable Sustainable Energy Rev 80: 149–162. https://doi.org/10.1016/j.rser.2017.05.177 doi: 10.1016/j.rser.2017.05.177
|
| [32] | Moeketsi M (2019) 2018 Annual Report by Central Bank of Lesotho. Lesotho: Mininstry of Finance. Available from: https://www.centralbank.org.ls/images/Publications/ANNUAL_REPORTS/2019_CBL_Annual_Report_-_07.09.2020.pdf. |
| [33] | Seleteng M (2010) Inflation and Economic Growth: An estimate of an optimal level of inflation in Lesotho. Maseru Lesotho: Central Bank of Lesotho. 16. Available from: https://www.centralbank.org.ls/images/Publications/Research/Papers/Working/Inflation__Econo_Growth.pdf. |
| [34] |
Gonzalez R, Daystar J, Jett M, et al. (2012) Economics of cellulosic ethanol production in a thermochemical pathway for softwood, hardwood, corn stover and switchgrass. Fuel Process Technol 94: 113–122. https://doi.org/10.1016/j.fuproc.2011.10.003 doi: 10.1016/j.fuproc.2011.10.003
|
| [35] |
Fernández-González JM, Grindlay AL, Serrano-Bernardo F, et al. (2017) Economic and environmental review of Waste-to-Energy systems for municipal solid waste management in medium and small municipalities. Waste Manage 67: 360–374. https://doi.org/10.1016/j.wasman.2017.05.003 doi: 10.1016/j.wasman.2017.05.003
|
| [36] |
Ayodele TR, Ogunjuyigbe ASO, Alao MA (2018) Economic and environmental assessment of electricity generation using biogas from organic fraction of municipal solid waste for the city of Ibadan, Nigeria. J Cleaner Prod 203: 718–735. https://doi.org/10.1016/j.jclepro.2018.08.282 doi: 10.1016/j.jclepro.2018.08.282
|
| [37] | Short W, Packey DJ, Holt T (1995) A manual for the economic evaluation of energy efficiency and renewable energy technologies. National Renewable Energy Lab. (NREL), Golden, CO (United States). https://doi.org/10.2172/35391 |
| [38] |
Cudjoe D, Han MS (2020) Economic and environmental assessment of landfill gas electricity generation in urban districts of Beijing municipality. Sustainable Prod Consumption 23: 128–137. https://doi.org/10.1016/j.spc.2020.04.010 doi: 10.1016/j.spc.2020.04.010
|
| [39] |
Leme MMV, Rocha MH, Lora EES, et al. (2014) Techno-economic analysis and environmental impact assessment of energy recovery from Municipal Solid Waste (MSW) in Brazil. Resour, Conserv Recycl 87: 8–20. https://doi.org/10.1016/j.resconrec.2014.03.003 doi: 10.1016/j.resconrec.2014.03.003
|
| [40] |
Dong J, Tang Y, Nzihou A, et al. (2018) Life cycle assessment of pyrolysis, gasification and incineration waste-to-energy technologies: Theoretical analysis and case study of commercial plants. Sci Total Environ 626: 744–753. https://doi.org/10.1016/j.scitotenv.2018.01.151 doi: 10.1016/j.scitotenv.2018.01.151
|
| [41] |
Shabib A, Abdallah M (2020) Life cycle analysis of waste power plants: systematic framework. Int J Environ Stud 77: 786–806. https://doi.org/10.1080/00207233.2019.1708146 doi: 10.1080/00207233.2019.1708146
|
| [42] | Selibe Mochoboroane (2015) Lesotho Energy Policy. Maseru Lesotho: Ministry of Energy and Meteorology. Available from: https://worldcat.org/title/1033543233. |
| [43] | International Renewable Energy Agency (2012) Biomass for power generation. IRENA Abu Dhabi, UAE. Available from: https://www.irena.org/publications/2012/Jun/Renewable-Energy-Cost-Analysis---Biomass-for-Power-Generation. |
| [44] |
Cudjoe D, Nketiah E, Obuobi B, et al. (2021) Forecasting the potential and economic feasibility of power generation using biogas from food waste in Ghana: Evidence from Accra and Kumasi. Energy 226: 120342. https://doi.org/10.1016/j.energy.2021.120342 doi: 10.1016/j.energy.2021.120342
|
| [45] |
Suryati I, Farindah A, Indrawan I (2021) Study to reduce greenhouse gas emissions at waste landfill in Medan City. IOP Conference Series: Earth Environ Sci 894: 012005. https://doi.org/10.1088/1755-1315/894/1/012005 doi: 10.1088/1755-1315/894/1/012005
|
| [46] |
Mohareb AK, Warith MA, Diaz R (2008) Modelling greenhouse gas emissions for municipal solid waste management strategies in Ottawa, Ontario, Canada. Resour, Conserv Recycl 52: 1241–1251. https://doi.org/10.1016/j.resconrec.2008.06.006 doi: 10.1016/j.resconrec.2008.06.006
|
| [47] | Change I (2006) 2006 IPCC guidelines for national greenhouse gas inventories. Institute for Global Environmental Strategies, Hayama, Kanagawa, Japan. |
| [48] | Assamoi B, Lawryshyn Y (2012) The environmental comparison of landfilling vs. incineration of MSW accounting for waste diversion. Waste Manage 32: 1019–1030. https://doi.org/10.1016/j.wasman.2011.10.023 |
| [49] |
Moberg Å, Finnveden G, Johansson J, et al. (2005) Life cycle assessment of energy from solid waste—part 2: landfilling compared to other treatment methods. J Cleaner Prod 13: 231–240. https://doi.org/10.1016/j.jclepro.2004.02.025 doi: 10.1016/j.jclepro.2004.02.025
|
| [50] |
Finnveden G, Johansson J, Lind P, et al. (2005) Life cycle assessment of energy from solid waste—part 1: general methodology and results. J Cleaner Prod 13: 213–229. https://doi.org/10.1016/j.jclepro.2004.02.023 doi: 10.1016/j.jclepro.2004.02.023
|
| [51] |
Finnveden G, Moberg Å (2005) Environmental systems analysis tools–an overview. J Cleaner Prod 13: 1165–1173. https://doi.org/10.1016/j.jclepro.2004.06.004 doi: 10.1016/j.jclepro.2004.06.004
|
| [52] | Guendehou S, Koch M, Hockstad L, et al. (2006) Incineration and Open Burning of Waste. 2006 IPCC Guidelines for National Greenhouse Gas Inventories. Japan: Institute for Global Environmental Strategies (IGES). Available from: https://nswmc.emb.gov.ph/wp-content/uploads/2022/08/2006-IPCC-Guidelines-for-National-Greenhouse-Gas-Inventories.pdf. |
| [53] | EPA U (2018) Emission factors for greenhouse gas inventories Stationary combustion emission factors. Go to reference in article. Available from: https://www.epa.gov/sites/default/files/2018-03/documents/emission-factors_mar_2018_0.pdf. |
| [54] |
Kweku DW, Bismark O, Maxwell A, et al. (2018) Greenhouse effect: greenhouse gases and their impact on global warming. J Sci Res Rep 17: 1–9. https://doi.org/10.9734/JSRR/2017/39630 doi: 10.9734/JSRR/2017/39630
|
| [55] | Guo Y, Glad T, Zhong Z, et al. (2018) Environmental life-cycle assessment of municipal solid waste incineration stocks in Chinese industrial parks. Resources, Conservation and Recycling 139: 387–395. https://doi.org/10.1016/j.resconrec.2018.05.018 |
| [56] |
Yao X, Guo Z, Liu Y, et al. (2019) Reduction potential of GHG emissions from municipal solid waste incineration for power generation in Beijing. J Cleaner Prod 241: 118283. https://doi.org/10.1016/j.jclepro.2019.118283 doi: 10.1016/j.jclepro.2019.118283
|
| [57] | EPA U (1996) Solid Waste Disposal. Refuse Combustion 42. Available from: https://www3.epa.gov/ttnchie1/ap42/ch02/. |
| [58] |
Kumar A, Sharma M (2014) Estimation of GHG emission and energy recovery potential from MSW landfill sites. Sustainable Energy Technol Assess 5: 50–61. https://doi.org/10.1016/j.seta.2013.11.004 doi: 10.1016/j.seta.2013.11.004
|
| [59] |
Kale C, Gökçek M (2020) A techno-economic assessment of landfill gas emissions and energy recovery potential of different landfill areas in Turkey. J Cleaner Prod 275: 122946. https://doi.org/10.1016/j.jclepro.2020.122946 doi: 10.1016/j.jclepro.2020.122946
|
| [60] |
Shunda l, Jiang X, Zhao Y, et al. (2022) Disposal technology and new progress for dioxins and heavy metals in fly ash from municipal solid waste incineration: A critical review. Environ Pollut 311: 119878. https://doi.org/10.1016/j.envpol.2022.119878 doi: 10.1016/j.envpol.2022.119878
|
| [61] |
Yang L, Liu G, Zhu Q, et al. (2019) Small-scale waste incinerators in rural China: Potential risks of dioxin and polychlorinated naphthalene emissions. Emerging Contam 5: 31–34. https://doi.org/10.1016/j.emcon.2019.01.001 doi: 10.1016/j.emcon.2019.01.001
|
Figures(7) / Tables(3)

Tsepo Sechoala, Olawale Popoola, Temitope Ayodele. Economic and environmental assessment of electricity generation using biogas and heat energy from municipal solid waste: A case study of Lesotho[J]. AIMS Energy, 2023, 11(2): 337-357. doi: 10.3934/energy.2023018


 DownLoad: