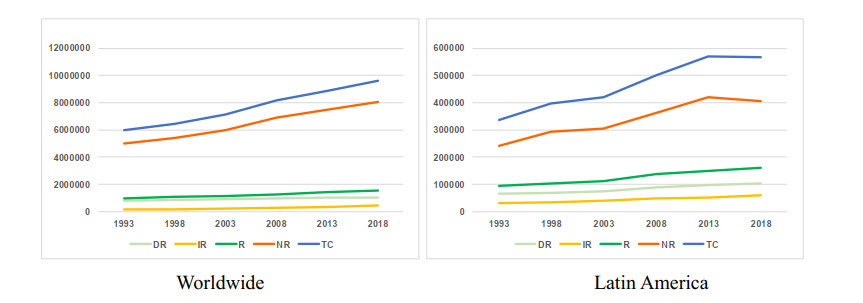
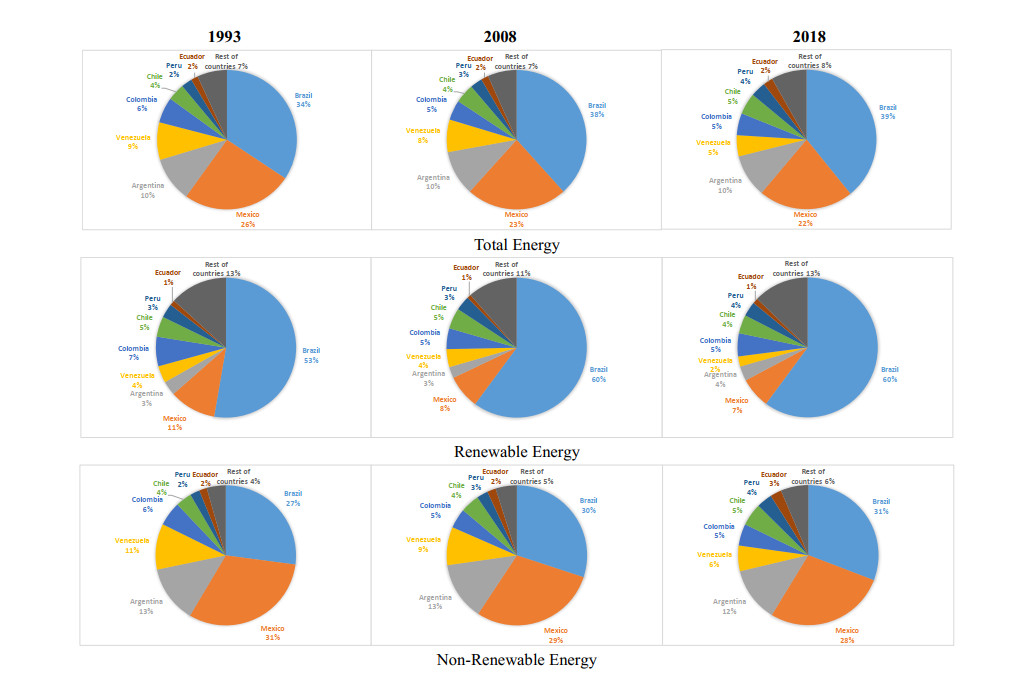
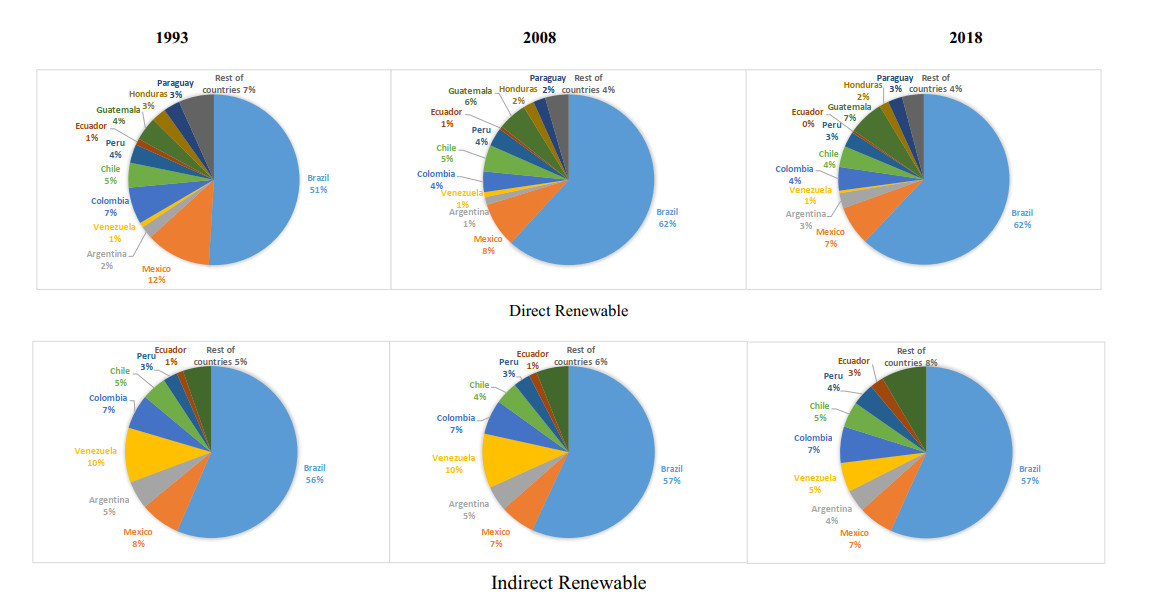
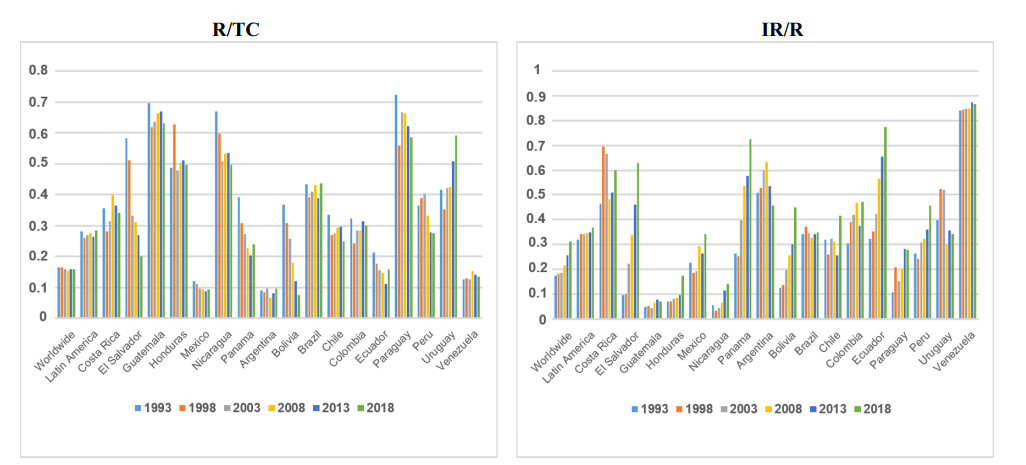
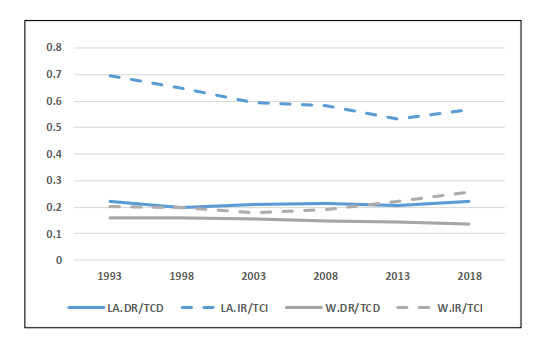
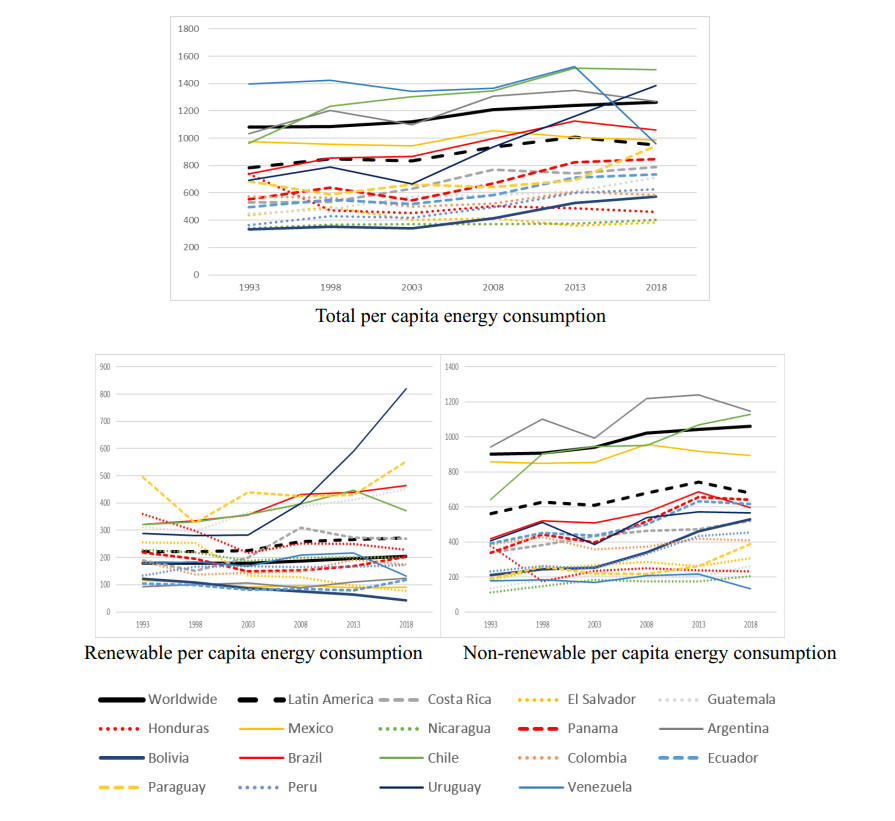
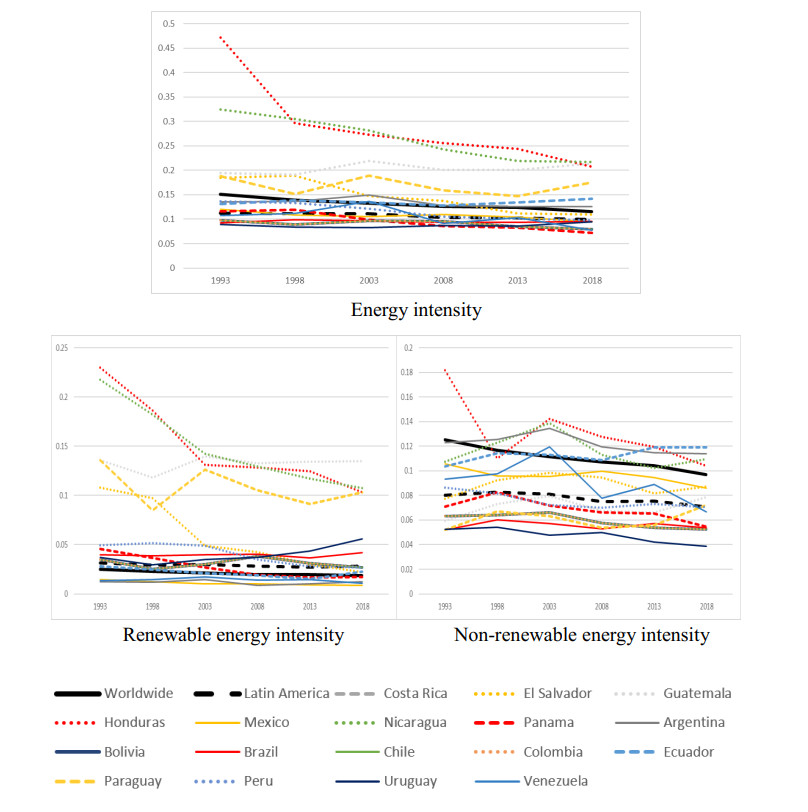
Since the signing of the Paris Agreement in 2015, signatory countries have been adopting commitments to promote the use of renewable energy. Among the signatory countries, those of Latin America have stood out for the high percentage of renewables in their energy mix and their commitment to continue advancing towards energy decarbonization. This commitment implies the need to adequately recognize the starting point of renewable energy consumption in the region, and its relationship with the population and regional production. This study analyzes the evolution of renewable energy consumption in the Latin American region and its member countries, in relation to the Worldwide position, from 1993 to 2018. For this, the direct consumption of renewable energies and the energy used to generate electricity and heat, have been considered. These values are analyzed in Worldwide per capita and per unit production terms. The results show that the Latin American region has a higher percentage of renewables in its energy mix than Worldwide, with this percentage being even higher when considering only the consumption of renewable energies of indirect origin. Brazil stands out for the share of its renewable consumption. In terms of per capita renewable energy consumption, Latin America presents higher values than those achieved Worldwide, with a growing trend throughout the studied period. The renewable energy intensity is also higher in Latin America, with a decreasing trend, as experienced Worldwide.
Citation: María P. Pablo-Romero, Antonio Sánchez-Braza, Manuel González-Pablo Romero. Renewable energy in Latin America[J]. AIMS Energy, 2022, 10(4): 695-717. doi: 10.3934/energy.2022033
Since the signing of the Paris Agreement in 2015, signatory countries have been adopting commitments to promote the use of renewable energy. Among the signatory countries, those of Latin America have stood out for the high percentage of renewables in their energy mix and their commitment to continue advancing towards energy decarbonization. This commitment implies the need to adequately recognize the starting point of renewable energy consumption in the region, and its relationship with the population and regional production. This study analyzes the evolution of renewable energy consumption in the Latin American region and its member countries, in relation to the Worldwide position, from 1993 to 2018. For this, the direct consumption of renewable energies and the energy used to generate electricity and heat, have been considered. These values are analyzed in Worldwide per capita and per unit production terms. The results show that the Latin American region has a higher percentage of renewables in its energy mix than Worldwide, with this percentage being even higher when considering only the consumption of renewable energies of indirect origin. Brazil stands out for the share of its renewable consumption. In terms of per capita renewable energy consumption, Latin America presents higher values than those achieved Worldwide, with a growing trend throughout the studied period. The renewable energy intensity is also higher in Latin America, with a decreasing trend, as experienced Worldwide.

| [1] | United Nations (2015) Paris Agreement. Available from: http://unfccc.int/files/essential_background/convention/application/pdf/english_paris_agreement.pdf. |
| [2] |
Washburn C, Pablo-Romero M (2019) Measures to promote renewable energies for electricity generation in Latin American countries. Energy Policy 128: 212–222. https://doi.org/10.1016/j.enpol.2018.12.059 doi: 10.1016/j.enpol.2018.12.059

|
| [3] | Enerdata (2022) Global Energy Statistical Yearbook 2021. Available from: https://yearbook.enerdata.net/renewables/renewable-in-electricity-production-share.html. |
| [4] |
Harjanne A, Korhonen JM (2019) Abandoning the concept of renewable energy. Energy Policy 127: 330–340. https://doi.org/10.1016/j.enpol.2018.12.029 doi: 10.1016/j.enpol.2018.12.029
|
| [5] |
Zhang Y, Jin W, Xu M (2021) Total factor efficiency and convergence analysis of renewable energy in Latin American countries. Renewable Energy 170: 785–795. https://doi.org/10.1016/j.renene.2021.02.016 doi: 10.1016/j.renene.2021.02.016
|
| [6] | ECLAC (2019) Quadrennial Report on Regional Progress and Challenges in relation to the 2030 Agenda for Sustainable Development in Latin America and the Caribbean. Economic Commission for Latin America and the Caribbean, United Nations. Available from: https://repository.eclac.org/handle/11362/44552. |
| [7] |
Viviescas C, Lima L, Diuana FA, et al. (2019) Contribution of variable renewable energy to increase energy security in Latin America: Complementarity and climate change impacts on wind and solar resources. Renewable Sustainable Energy Rev 30: 109232. https://doi.org/10.1016/j.rser.2019.06.039 doi: 10.1016/j.rser.2019.06.039
|
| [8] |
Koengkan M, Fuinhas JA (2020) Exploring the effect of the renewable energy transition on CO2 emissions of Latin American & Caribbean countries. Int J Sustainable Energy 39: 515–538. https://doi.org/10.1080/14786451.2020.1731511 doi: 10.1080/14786451.2020.1731511
|
| [9] | REN21 (2020) Renewables 2020 Global Status Report. REN21 Secretariat: Paris. Available from: https://www.ren21.net/wp-content/uploads/2019/05/gsr_2020_full_report_en.pdf. |
| [10] |
Al-Mulali U, Fereidouni HG, Lee JYM (2014) Electricity consumption from renewable and non-renewable sources and economic growth: Evidence from Latin American countries. Renewable Sustainable Energy Rev 30: 290–298. https://doi.org/10.1016/j.rser.2013.10.006 doi: 10.1016/j.rser.2013.10.006
|
| [11] | Koengkan M, Fuinhas JA, Kazemzadeh E (2022) Do financial incentive policies for renewable energy development increase the economic growth in Latin American and Caribbean countries? J Sustainable Finance Investment, 1–23. https://doi.org/10.1080/20430795.2022.2031849 |
| [12] |
Fuinhas JA, Marques A, Koengkan M (2017) Are renewable energy policies upsetting carbon dioxide emissions? The case of Latin America countries. Environ Sci Pollut Res 24: 15044–15054. https://doi.org/10.1007/s11356-017-9109-z doi: 10.1007/s11356-017-9109-z
|
| [13] |
Jacobs D, Marzolf N, Paredes JR, et al. (2013) Analysis of renewable energy incentives in the Latin America and Caribbean region: The feed-in tariff case. Energy Policy 60: 601–610. https://doi.org/10.1016/j.enpol.2012.09.024 doi: 10.1016/j.enpol.2012.09.024
|
| [14] |
Pfeiffer B, Mulder P (2013) Explaining the diffusion of renewable energy technology in developing countries. Energy Econ 40: 285–296. https://doi.org/10.1016/j.eneco.2013.07.005 doi: 10.1016/j.eneco.2013.07.005
|
| [15] |
Bersalli G, Menanteau P, El-Methni J (2020) Renewable energy policy effectiveness: A panel data analysis across Europe and Latin America. Renewable Sustainable Energy Rev 133: 110351. https://doi.org/10.1016/j.rser.2020.110351 doi: 10.1016/j.rser.2020.110351
|
| [16] | IRENA (2016). Renewable Energy Market Analysis: Latin America. International Renewable Energy Agency: Abu Dhabi. Available from: https://www.irena.org/publications/2016/Nov/Renewable-Energy-Market-Analysis-Latin-America. |
| [17] | REN21 (2021) Renewables 2021 Global Status Report. REN21 Secretariat: Paris. Available from: https://www.ren21.net/wp-content/uploads/2019/05/GSR2021_Full_Report.pdf. |
| [18] | IRENA (2022) Data & Statistics. International Renewable Energy Agency: Abu Dhabi. Available from: https://www.irena.org/Statistics. |
| [19] |
Rubio MM, Tafunell X (2014) Latin American hydropower: A century of uneven evolution. Renewable Sustainable Energy Rev 38: 323–334. https://doi.org/10.1016/j.rser.2014.05.068 doi: 10.1016/j.rser.2014.05.068
|
| [20] |
Arango-Aramburo S, Ríos-Ocampo JP, Larsen ER (2020) Examining the decreasing share of renewable energy amid growing thermal capacity: The case of South America. Renewable Sustainable Energy Rev 119: 109648. https://doi.org/10.1016/j.rser.2019.109648 doi: 10.1016/j.rser.2019.109648
|
| [21] |
Shirley R, Kammen D (2013) Renewable energy sector development in the Caribbean: Current trends and lessons from history. Energy Policy 57: 244–252. https://doi.org/10.1016/j.enpol.2013.01.049 doi: 10.1016/j.enpol.2013.01.049
|
| [22] |
Mele M (2019) Renewable energy consumption: the effects on economic growth in Mexico. Int J Energy Econ Policy 9: 269–273. https://doi.org/10.32479/ijeep.7460 doi: 10.32479/ijeep.7460
|
| [23] |
Pietrosemoli L, Rodríguez-Monroy C (2019) The Venezuelan energy crisis: Renewable energies in the transition towards sustainability. Renewable Sustainable Energy Rev 105: 415–426. https://doi.org/10.1016/j.rser.2019.02.014 doi: 10.1016/j.rser.2019.02.014
|
| [24] |
Lima MA, Mendes LFR, Mothé GA, et al. (2020) Renewable energy in reducing greenhouse gas emissions: Reaching the goals of the Paris agreement in Brazil. Environ Dev 33: 100504. https://doi.org/10.1016/j.envdev.2020.100504 doi: 10.1016/j.envdev.2020.100504
|
| [25] | IEA (2022) Data and Statistics. International Energy Agency. Available from: https://www.iea.org/data-and-statistics/data-tables?country=WORLD&energy=Balances&year=2018. |
| [26] | World Bank (2022) Databank, Development Indicators. Available from: https://databank.bancomundial.org/source/world-development-indicators. |
| [27] |
Pablo-Romero M, Pozo-Barajas R, Yñiguez R (2017) Global changes in residential energy consumption. Energy Policy 101: 342–352. https://doi.org/10.1016/j.enpol.2016.10.032 doi: 10.1016/j.enpol.2016.10.032
|
| [28] |
Fornillo B (2021) Energy transition in Uruguay: market dominance or public-social power? Ambiente Soc 24: 15. https://doi.org/10.1590/1809-4422asoc20190229r1vu2021l1de doi: 10.1590/1809-4422asoc20190229r1vu2021l1de
|
| [29] | OECD (2013) OECD Environmental Performance Reviews: Mexico 2013. Organization for Economic Co-operation and Development, OECD Publishing: Paris. Available from https://read.oecd-ilibrary.org/environment/oecd-environmental-performance-reviews-mexico-2013_9789264180109-en#page1. |
| [30] | BNEF (2016) Renewable Energy Insight-2015 Latin America Investment Numbers. Bloomberg New Energy Finance, BNEF Desktop. Available from (subscription required): https://energydata.info/organization/bloomberg-new-energy-finance. |
| [31] | Enerdata (2021) Global Energy Trends 2021 Edition. Available from: https://www.enerdata.net/publications/reports-presentations/world-energy-trends.html. |
| [32] |
Yuping L, Ramzan M, Xincheng L, et al. (2021) Determinants of carbon emissions in Argentina: The roles of renewable energy consumption and globalization. Energy Rep: 7: 4747–4760. https://doi.org/10.1016/j.egyr.2021.07.065 doi: 10.1016/j.egyr.2021.07.065
|
| [33] |
Henry CL, Baker JS, Shaw BK, et al. (2021) How will renewable energy development goals affect energy poverty in Guatemala? Energy Econ 104: 105665. https://doi.org/10.1016/j.eneco.2021.105665 doi: 10.1016/j.eneco.2021.105665
|
| [34] |
Flores WC (2018) Honduras' Energy Policy: Post Coup d'état Energy Scenarios. Latin American Policy 9: 331–348. https://doi.org/10.1111/lamp.12147 doi: 10.1111/lamp.12147
|
| [35] |
Blanco Orozco NV (2021) Barreras de regulación para la inserción de las energías renovables en sistemas de generación distribuida a pequeña escala, caso Nicaragua. Nexo Revista Científica 34: 1623–1631. https://doi.org/10.5377/nexo.v34i06.13123 doi: 10.5377/nexo.v34i06.13123
|
| [36] |
Zhang X, Li HY, Deng ZD, et al. (2018) Impacts of climate change, policy and Water-Energy-Food nexus on hydropower development. Renewable Energy 116: 827–834. https://doi.org/10.1016/j.renene.2017.10.030 doi: 10.1016/j.renene.2017.10.030
|
| [37] |
Sheinbaum-Pardo C, Ruiz BJ (2012) Energy context in Latin America. Energy 40: 39–46. https://doi.org/10.1016/j.energy.2011.10.041 doi: 10.1016/j.energy.2011.10.041
|
Figures(7) / Tables(3)

María P. Pablo-Romero, Antonio Sánchez-Braza, Manuel González-Pablo Romero. Renewable energy in Latin America[J]. AIMS Energy, 2022, 10(4): 695-717. doi: 10.3934/energy.2022033


 DownLoad: