Citation: Charalambos Chasos, George Karagiorgis, Chris Christodoulou. Technical and Feasibility Analysis of Gasoline and Natural Gas Fuelled Vehicles[J]. AIMS Energy, 2014, 2(1): 71-88. doi: 10.3934/energy.2014.1.71
[1] | Ibrahim Thamer Nazzal, Mohammed kamil . Energy and exergy analysis of spark ignited engine fueled with Gasoline-Ethanol-Butanol blends. AIMS Energy, 2020, 8(6): 1007-1028. doi: 10.3934/energy.2020.6.1007 |
[2] | Saad S. Alrwashdeh . Investigation of the effect of the injection pressure on the direct-ignition diesel engine performance. AIMS Energy, 2022, 10(2): 340-355. doi: 10.3934/energy.2022018 |
[3] | Daido Fujita, Takahiko Miyazaki . Techno-economic analysis on the balance of plant (BOP) equipment due to switching fuel from natural gas to hydrogen in gas turbine power plants. AIMS Energy, 2024, 12(2): 464-480. doi: 10.3934/energy.2024021 |
[4] | Yu-Huei Cheng, Ching-Ming Lai, Jiashen Teh . Genetic algorithm with small population size for search feasible control parameters for parallel hybrid electric vehicles. AIMS Energy, 2017, 5(6): 930-943. doi: 10.3934/energy.2017.6.930 |
[5] | Dheeraj Rathore, Anoop Singh, Divakar Dahiya, Poonam Singh Nigam . Sustainability of biohydrogen as fuel: Present scenario and future perspective. AIMS Energy, 2019, 7(1): 1-19. doi: 10.3934/energy.2019.1.1 |
[6] | Susana Silva, Isabel Soares, Carlos Pinho . Dynamic behavior of transport fuel demand and regional environmental policy: The case of Portugal. AIMS Energy, 2021, 9(5): 899-914. doi: 10.3934/energy.2021042 |
[7] | Patrick Moriarty, Damon Honnery . Energy policy and economics under climate change. AIMS Energy, 2018, 6(2): 272-290. doi: 10.3934/energy.2018.2.272 |
[8] | Simona Silvia Merola, Luca Marchitto, Cinzia Tornatore, Gerardo Valentino . Spray-combustion process characterization in a common rail diesel engine fuelled with butanol-diesel blends by conventional methods and optical diagnostics. AIMS Energy, 2014, 2(2): 116-132. doi: 10.3934/energy.2014.2.116 |
[9] | Tingting Wu, Kakali Mukhopadhyay, Paul J. Thomassin . A life cycle inventory analysis of wood pellets for greenhouse heating: a case study at Macdonald campus of McGill University1. AIMS Energy, 2016, 4(5): 697-722. doi: 10.3934/energy.2016.5.697 |
[10] | Husam Al-Mashhadani, Sandun Fernando . Properties, performance, and applications of biofuel blends: a review. AIMS Energy, 2017, 5(4): 735-767. doi: 10.3934/energy.2017.4.735 |
The main objective of the present study is to examine the large scale adaptation of natural gas as vehicle fuel, in the economy of the Cyprus Republic which during the next decade envisages the exploration of considerable amounts of natural gas, which can be used for local consumption and for exports. The main goals of the present study include the technical analysis and the economical feasibility analysis of the introduction of natural gas vehicles compared to the existing status of gasoline vehicles which can be replaced at large scale.
The natural gas can be used in combustion systems for power generation and for propulsion purposes. Natural gas can be explored from large fossil fuel reserves, and can also be produced from biomass, waste treatment and hydrogen electrolysis processes. The natural gas main ingredient is methane CH4 which has low carbon content and is considered a less environmentally harmful fuel than conventional fossil fuels which are currently used in internal combustion engines. Compressed natural gas is mainly used in spark-ignition engines [5], but is also tested in Diesel engines where the soot production is negligible. Recently, a European st and ard [19] was published which describes the fuel quality for compressed natural gas vehicles.
Natural gas internal combustion engines(ICE)have been produced and are used in vehicles. There are engines with port fuel injection system and engines with direct injection system. Direct injection of fuel into the cylinder of the engine can supply the exact amount of fuel for the corresponding engine speed and load. The direct injection system is considered to produce better quality of air-fuel mixture in the cylinder than the mixture which is produced with port fuelsystems [1]. The fuel injection timing as well as the quality of the air-fuel mixture(stoichiometric or weak in fuel)affects the engine performance and emissions [4]. The emissions of unburnt hydrocarbons produced by natural gas vehicles are found to be lower than the emissions of gasoline fueled vehicles [3]. The NOx emissions were reduced when the engine operated for a weak in fuel mixture [2], but variations from cycle to cycle of the engine operation were high resulting in unstable engine operation. It is known that internal combustion engines should operate close to stoichiometric mixture to avoid unfavorable engine phenomena; however it would be preferred to operate the natural gas engines closer to stoichiometry.
Conventional internal combustion engines of vehicles fueled with gasoline can be modified in order to operate with natural gas. The main modifications include the natural gas tank, equipped with special safety components and valves, the engine control unit, the gas filter, special sensors and the gas injection unit. The modifications should be performed by licensed automotive stations and regulated by the law. However, there is a cost related with the modifications which depends on the age of the conventional vehicle which is to be modified. The feasibility of the modification for the expected period of usage of the vehicle, and furthermore the modifications on vehicle fleet at national level for large scale adaptation of natural gas should be investigated. Also, there are modified engines which can operate with dual fuel systems in order to switch to different fuel according to the operating conditions and engine load dem and . It should be mentioned that existing ICE are designed and optimized for using liquid fossil fuels, and the utilization of natural gas is expected to affect the performance behavior of the engine. Thus, research is required in order to design new ICE with increased efficiency when natural gas is used.
Considerable amounts of natural gas fuel are required for large scale adaptation of natural gas vehicles. Recently, at the area of the exclusive economic zone(EEZ)of the Republic of Cyprus a commercial discovery has been identified. The discovery can be exploited commercially after consideration of all pertinent operating and financial data collected during the performance of the appraisal work programme for natural gas recoverable reserves, sustainable production levels and other relevant technical and economic factors, according to generally accepted international petroleum industry practice [10].
Pipelines and related transport and storage facilities will be required for transportation of hydrocarbons that will be produced in the EEZ to the storage systems and delivery points. However, there will also be high associated costs for the supply of natural gas from the terrestrial storage systems to the vehicle filling stations which will be required to be erected, via a network of natural gas pipelines, compressors and auxiliary equipment.
The natural gas can be stored as compressed natural gas(CNG)or liquefied natural gas(LNG). However, the infrastructure has not been fully developed and there will be need for development of natural gas filling stations for the supply of natural gas. CNG requires four times the volume of gasoline for the same energy content [5]. CNG can be liquefied at -162 °C into LNG, but liquefaction requires energy consumption. The storage capacity of LNG is approximately by factor of three greater than the storage capacity of CNG [5].
Natural gas fuel supply to vehicles can be provided by special fuel stations. In some cities there exist few distribution points of natural gas [7], but the change from conventional fossil fuels to natural gas is expected to be slow with high associated costs [7]. This will require national and European planning with substantial technical and economical investigations for the new technology to be adapted, including both the vehicles technologies and the infrastructure for the supply of natural gas fuel. In Europe, in 2013 approximately 1 million vehicles were fuelled with CNG and around 3000 filling stations were operating [8]. Italy has developed an infrastructure for natural gas fuelling stations, with increased development in the north of Italy. Also, the legislation of Italy allowed the construction of multi-fuel stations with CNG or small CNG stations next to conventional petrol and Diesel fuel stations, as well as providing the possibility to install self-service refuelling systems at the CNG filling stations [8]. The average cost of natural gas stations in Italy was 300, 000 Euro and related funding schemes for the installation of new stations have been provided by the state [8].
The price of natural gas per energy content is lower than gasoline and Diesel fuel according to published market data [16]. Also, economically viable adaptation of natural gas vehicles could materialise with the intervention of the European Union(EU) and local governments in order to avoid fragmented EU level markets and enable EU-wide mobility for natural gas vehicles [9].
The present paper investigates the vehicles with spark-ignition engines, namely gasoline internal combustion engines and natural gas internal combustion engines. The technical analysis calculates the required annual fuel consumption by the total number of vehicles using SI engine and using either gasoline or natural gas fuel. The resulting amounts of carbon dioxide emissions are also calculated. An economical analysis is performed using statistical data on annual fuel imports and annual fuel consumption for transportation and data on the vehicles fleet for the case study of the Cyprus Republic. The economical analysis examines the scenario of investment from the local government on the infrastructure for the supply of natural to filling stations and the erection of filling stations at national scale, while the local government will own and sell the natural gas to consumers.
Here, the methodology for the technical and economical analyses is described. First the technical model is presented and then the linkage between the technical and economical model is explained, followed by the presentation of the economical model.
The technical model uses the physical properties of the two fuels and the thermal efficiency of ICE. The resulting exhaust gas emissions are also estimated by the technical model using the equation of combustion.
For the purposes of the present study, data on the fuel imports for transportation is used, along with an average thermal efficiency of gasoline ICE [6] and natural gas ICE. The quantity of gasoline fuel imported per year, Qf, and the thermal efficiency of ICE are used in the analysis. The total energy of the imported fuel for gasoline vehicles and the amount of energy produced by all gasoline vehicles empowered with ICE are calculated from the following equations:
Ef=QfLHVf
where Ef is the annual total energy of the imported fuel, Qf is the annual total quantity of gasoline fuel imported for transportation in Kg and LHVf is the lower heating value of gasoline in KJ/Kg, and ,
EV=Efnth,ICE
where EV is the annual energy produced by all the vehicles, and nth,ICE
The quantity of mass of the required natural gas in Kg per year which is to be supplied to the natural gas fuelled vehicles is calculated from,
QNG=EVnth,NGLHVNG
The amount of CO2 emitted from vehicles is calculated by the combustion equation of fuel with air using the chemical compound of the fuel and its molecular weight. The amount of CO2 emitted is estimated as:
QCO2,i=NCMCO2MfQf,i
where NC is the number of carbon atoms for the fuel, MCO2 is the molecular weight of carbon dioxide, and Mf is the molecular weight of the fuel considered. Qf,i
The amount of CO2 emitted from a single gasoline and natural gas vehicle per Km travelled by the vehicle in g/Km is estimated according to the European steady-state cycle [5], considering 13 operating points, by the following equation as:
QCO2,i1Km=13∑j=1NCMCO2PI,jfjMf,iVav,jnIT,jLHVi
where j is the operating point of the engine, PI,j
The estimated performance characteristics of the two types of engines from the technical analysis, along with local statistical data on annual fuel imports and annual fuel consumption for transportation and data on the vehicles fleet are used for the case study calculations. Data of natural gas prices is also used in the economical model. The economical model estimates the capital cost of the investment in the new technology, the amount of income because of carbon dioxide emissions avoidance and the income from selling natural gas. The annual cashflow and the capital cost are used for the estimation of the net present value(NPV) and the internal rate of return(IRR)of the investment of large scale adaptation of natural gas fuelled vehicles for the case study. Any finance charges involved with the investment in pertinent infrastructures are not accounted in the present analysis.
The capital cost of the investment by the Cyprus Republic consists of the funding cost of erection of natural gas fuelling stations, the funding cost for the installation of the piping system for the supply of natural gas to the fuelling stations and the funding cost for the purchase of natural gas vehicles by the consumers. The capital cost in Euro, Cc, is estimated by:
Cc=Cs+CP+CNGV
where Cs is the cost for funding of fuelling stations, Cp is the cost for the piping network and CNGV
Cs=FSNSPS
where FS
CP=LPPP
where LP
CNGV=FNGVNNGVPNGV
where FNGV
It is assumed that the amount of natural gas which is consumed on an annual basis is the income for the Cyprus Republic which is considered to be the investor in the new technology. The selling price of natural gas is estimated using the current average selling price of natural gas in Europe, found from market source [16] and it is equal to 26 Euro/MWh which results in 0.325 Euro/Kg of natural gas. However, the erection of liquefaction plants and the storage systems of natural gas, as well as relevant operation and maintenance costs are not considered in the present economical model. The basic assumption of the present study is that the Cyprus Republic will be an extractor of considerably large amounts of natural gas which will be used for local consumption as well as for exports of liquefied natural gas.
The income from the investment in the new technology is considered to be the annual cash flow which is calculated from,
CFi=Ia,i+ICO2,i
where i is the running year index, Ia,i
The annual income from the natural gas fuel sales is calculated by,
Ia,i=QNGPNG(1+IR)i
where QNG
The annual avoidance of cost because of fines is given by,
ICO2,i=(QCO2,G−QCO2,NG)PCO2(1+IR)i
where QCO2,G
The NPV is calculated over the operation period of the new technology, and it is calculated by,
NPV=n∑i=1CFi(11+Rd)i−Cc
where n is the number of years for the operation of the investment and Rd
Finally, the IRR is calculated with a function which considers the cash flow of each year of operation of the technology and the capital cost for the new technology. IRR is the interest rate at which the incomes are equivalent to the costs of the investment.
For the analysis of the two types of vehicles, three scenarios are investigated for the technical and economical analysis. In all the scenarios, the adaptation of natural gas vehicles is considered to be of large scale, thus in order to achieve the transition to the new technology, the planning and building of the relevant infrastructure is assumed to materialize with the switch to the new technology. It is assumed that the switch to the new technology will be instantaneous, since this will provide immediate income to the Cyprus Republic from selling of the natural gas reserves.
• At the first scenario, 25% of the gasoline ICE vehicles fleet to be replaced by new natural gas vehicles
• At the second scenario, 50% of the gasoline ICE vehicles fleet to be replaced by new natural gas vehicles
• At the third scenario, all 100% of the gasoline ICE vehicles fleet to be replaced by new natural gas vehicles
The analysis is performed on an annual basis and a 25 year period of operation of the new technology from the base year is examined. For the base year 2013, average data for a year to present was used.
For the economical analysis, the effect of the selling price of natural gas on the investment is also studied by examining the reduction of the selling price by 25% and 50% compared to the base year average selling price.
In the Republic of Cyprus, there is a huge prospect with the exploration and exploitation of natural gas resources [11], and the subsequent erection of a liquefaction plant, within five years [10]. Thus, research activities should be directed towards the applications of natural gas and investigate the feasibility of adaptation of natural gas vehicles. Figure 1 shows the hydrocarbon exploration blocks at the area of EEZ of Cyprus. If it is proved that natural gas reserves are exploitable, then Cyprus Republic can switch to a wide range of natural gas applications including the introduction of natural gas vehicles at a large scale.
Many activities will be involved including the drilling of wells other than exploration wells and appraisal wells, the deepening, plugging, completing and equipping of such wells, along with the design, construction and installation of equipment. Equipment includes pipeline installations, production units and all other systems in conformity with sound oilfield and generally prevailing environmental practices in the international petroleum industry [10]. However, these factors and the associated costs are not considered in the present study.
The cost of installation of pipelines is enormous, and for inl and installation of natural gas pipelines an average cost of 750, 000 Euro per installed Km length of pipe is estimated from contract data [12] for a natural gas pipeline network development on the south coast of Cyprus, as shown in Figure 2.
For the present study, the statistical data is collected from the Statistical Service of the Republic of Cyprus [14] and includes the fuel imports for the years 2007, 2008 and 2009, the number of vehicles and their types registered in Cyprus Republic. Table 1 includes the quantity of imported fuel in tons per year for transportation with different fossil fuels(95 RON petrol, 100 RON petrol and Diesel with low sulphur), as well as the total amount of fossil fuels imported.
Fuel | Fuel Quantity imported in tons | ||
2007 | 2008 | 2009 | |
Unleaded gasoline 95RON | 313, 535 | 334, 079 | 343, 907 |
Unleaded gasoline 98RON | 38, 317 | 38, 597 | 39, 561 |
Diesel(gas oil low sulphur) | 350, 037 | 365, 982 | 348, 841 |
All fossil fuels | 2985, 841 | 3086, 409 | 2936, 121 |
From the data for fuel imports contained in Table 1, it is found that 23.5%, 23.9% and 24.9% for years 2007, 2008 and 2009, respectively, of the total amount of fossil fuels imported and consumed in Cyprus is used for transportation [18]. In the present study, the total amount of 350, 000 tons of gasoline is assumed to be consumed for transportation with gasoline vehicles for the base year of the analysis. Table 2 contains the number of vehicles according to their type which are registered in the Republic of Cyprus for the year 2008.
Vehicle type | Number of registered passenger vehicles |
Petrol ICE | 402, 435 |
Diesel ICE | 40, 248 |
Electric | 834 |
Total | 443, 517 |
As can be seen in Table 2, the total number of vehicles is 443, 517 and the majority is gasoline vehicles, which is the c and idate technology to be substituted by natural gas technology.
Table 3 includes the yearly amount of CO2 emissions emitted from transportation, as well as the total amount of CO2 for the years 2006 and 2007. The amount of CO2 emissions as a percentage of the total amount of CO2 emitted from all activities is 25.6% and 26.7% for the years 2006 and 2007, respectively. The statistical data on CO2emissions suggests that finding solutions such as the introduction of reduced carbon dioxide transportation technologies is required. Furthermore, the EU limit for the CO2emissions allowed for the Republic of Cyprus is much lower than the total amount that is currently emitted. For the years 2008-2012, the allowed limit is 5.48 million tons peryear [13, 14].
Activity | Yearly amount of CO2 emissions(thous and tons) | |
2006 | 2007 | |
Transportation | 2053.63 | 2193.70 |
All | 8025.12 | 8167.26 |
The data used for the technical and economical analysis is summarized in Table 5, respectively. The total number of gasoline vehicles is assumed 400, 000, and for the three scenarios 100, 000, 200, 000 and 400, 000 vehicles are used in the analysis, respectively. The thermal efficiency of gasoline ICE and natural gas ICE are assumed 25 % as shown in Table 4.
Parameter | Value |
Quantity of imported gasoline for the base year(Kg) | 350 million |
LHV of gasoline for ICE(KJ/Kg) | 44, 000 |
LHV of natural gas(KJ/Kg) | 50, 000 |
Thermal efficiency of gasoline ICE(%) | 25 |
Thermal efficiency of natural gas ICE(%) | 25 |
Parameter | Value |
Cost of the natural gas fuelling station | 300, 000 Euro |
Number of new stations | 100 |
Cost for the installation of the natural gas piping network | 750, 000 Euro/Km |
Length of piping network | 300 Km |
Natural gas spot price | 26 Euro/MWh |
EU emission allowance price | 10 Euro/t CO2 |
The data which is used for the economic analysis is included in Table 4. It includes the cost for the erection of new natural gas fuelling stations, the number of the natural gas filling stations to be erected around the state, the cost of installation of the gas piping network and the approximate length of the piping network. For the estimation of the cost of the emission fines the current rate of 10 Euro per ton of emitted CO2 is the average over the last two years, from the emissions trading system [15]. For the present analysis, the capital cost of a new natural gas vehicle is assumed to be the same as the cost of a new conventional gasoline vehicle of the same power output. Based on the earlier assumption, the funding percentage for a new natural gas vehicle is taken to be zero percent(0%)in the present analysis.
For the three scenarios examined, the required amount of natural gas can be found from Figure 3, including the data of scenarios of 25%, 50% and 100% replacement of SI engine vehicles, respectively.
From the data shown in Figure 3, it can be seen that the mass quantity of natural gas for fuelling the 400, 000 vehicles is lower than the amount of mass of gasoline.
Figure 4 shows the total CO2 emitted from the number of vehicles examined. When all the vehicles operate with gasoline the amount of CO2emissions is higher than the amount emitted when all the vehicles operate with natural gas. It can be seen that using natural gas vehicles instead of gasoline vehicles reduces CO2 emissions.
Further to the analysis of the total CO2 emitted from the number of vehicles examined, single vehicle estimations were performed for the CO2 emitted per Km for gasoline and natural gas vehicles, respectively. The CO2 emissions produced by a vehicle are proportional to the amount of fuel consumed and dependent on the chemical composition of the fuel. The engine speed and load conditions for the European steady-state cycle test include 13 operating points, as listed in Table 6.
j | Engine speed | Engine load(%) | Pb,j(KW) | Vav,j(Km/h) | fj |
1 | Idle | 0 | 0.5 | 5 | 0.083 |
2 | Speed of maximum torque | 10 | 2.2 | 10.8 | 0.08 |
3 | Speed of maximum torque | 25 | 5.5 | 27 | 0.08 |
4 | Speed of maximum torque | 50 | 11 | 54 | 0.08 |
5 | Speed of maximum torque | 75 | 16.5 | 81 | 0.08 |
6 | Speed of maximum torque | 100 | 22 | 108 | 0.25 |
7 | Idle | 0 | 0.5 | 5 | 0.083 |
8 | Speed of maximum power | 100 | 60.3 | 120 | 0.1 |
9 | Speed of maximum power | 75 | 45.2 | 90 | 0.02 |
10 | Speed of maximum power | 50 | 30.1 | 60 | 0.02 |
11 | Speed of maximum power | 25 | 15.1 | 30 | 0.02 |
12 | Speed of maximum power | 10 | 6 | 12 | 0.02 |
13 | Idle | 0 | 0.5 | 5 | 0.083 |
For the purposes of the calculations of the present study, the gasoline and natural gas vehicles were assumed to have the same chassis and weight. The two vehicles are assumed to produce the same indicated power with an indicated thermal efficiency of 30%, and travel with the same vehicle speed for each engine operating point as shown in Table. 6. The weighting factor of each operating point is also included in Table. 6. From the calculations, it is found that the gasoline vehicle produces 195 g/Km, while the natural gas vehicle emits 153 g/Km which results in a reduction of the emitted CO2 by more than 20%.
When large scale adaptation of natural gas vehicles is going to happen, then a huge investment by the government will be required. It is important to examine the number of vehicles which are going be introduced in order to identify whether the investment in infrastructure will be feasible. A criterion for feasibility can be considered as the lower limit of the IRR should be higher than the discount rate and around 10%. The investment in infrastructure is not expected to be dependent on the number of new natural gas vehicles. An inflation ratio of 2% and a discount rate of 6% were used in the economical analysis.
From the economical analysis, the NPV of the investment is shown in Figure 5. It can be seen that because of the increase of the number of natural gas vehicles the income from the sales of fuel will increase accordingly.
The estimated IRR is presented in Figure 6, where it can be seen that the introduction of an increased number of natural gas vehicles results in profitable investment when the current market selling price of natural gas is utilized. The scenario of 25% replacement gasoline vehicles with natural gas vehicles provides unfeasible investment, while the 50% replacement is promising and the complete 100% replacement is expected to be very profitable, along with the fact that harmful greenhouse effect carbon dioxide emissions will be reduced.
Further analysis was carried out for the case of 50% replacement of gasoline vehicles, i.e. introduction of 200, 000 new natural gas vehicles. For the analysis, the selling price of natural gas of 0.325 Euro/Kg which was used for the three scenarios already presented was reduced by 25% and 50%, in order to investigate the possibility for reduced fuel prices in the future.
The NPV of the investment for the three fuel prices is shown in Figure 7. It can be seen that when the fuel price increases, then the NPV of the investment increases which suggests that the investment is highly dependent on the fuel price.
Figure 8 shows the IRR of the investment for the scenario of 200, 000 vehicles when the natural gas selling price is varying. It can be observed that if the price of natural gas is reduced by 50%, then the investment is expected to be unfeasible.
When natural gas fuel is employed, then the mass of fuel required to empower vehicles is slightly reduced.
Introducing natural gas vehicles will result in reduced carbon dioxide emissions, thus the new technology will contribute to the reduction of the greenhouse effect.
Introducing natural vehicles at large scale will result in avoiding the imports of fossil fuel for transportation applications and the Cyprus national economy will benefit, since almost 25% of fuel imports are used for transportation.
The investment in large scale adaptation of natural gas vehicles will require a complete new infrastructure which will rely on other technologies such as liquefaction plants and natural gas storage and transportation systems.
The investment is expected to be feasible given that substantial numbers of new natural gas vehicles are introduced.
The adaptation of the new technology is expected to be gradual and incentives by the EU and the local government should be given to the consumers, in order to achieve large scale adaptation of natural gas vehicles.
Further investigations of natural gas ICE are required in order to achieve improved engine designs optimized to operate with natural gas, which is expected to improve thermal efficiency and life expectancy of the engine. The investigations include experiments, simulations and analysis of direct-injection natural gas ICE operating at increased compression ratio and with advanced supercharging systems.
Further economical analysis is recommended including examination of operation and maintenance costs of the infrastructure of natural gas fuelling, as well as associated costs for the utilization of the envisaged liquefaction plant.
Data and information provided from the Statistical Service of the Republic of Cyprus on fuel imports, emissions and registered vehicles is acknowledged.
All authors declare no conflicts of interest in this paper.
[1] | Abdullah, S., Kurniawan, W. H., Khamas, M., et al. (2011) Emission analysis of a compressed natural gas direct-injection engine with a homogeneous mixture. Int J Automot Techn. Vol. 12, No. 1, pages 29-38. |
[2] | Cho, H. M. and He, B. Q. (2008) Combustion and emission characteristics of a lean burn natural gas engine. Int J Automot Techn. Vol.92, No. 4, pages 415-422. |
[3] | Ristovski, Z., Morawska, L., Ayoko, G. A., et al. (2004) Emissions from a vehicle fitted to operate on either petrol or compressed natural gas. Sci Total Environ. Vol. 323, Issues 1-3, Pages 179-194. |
[4] | Bysveen, M. (2007) Engine characteristics of emissions and performance using mixtures natural gas and hydrogen. Energy, Vol. 32, Issue 4, Pages 482-489. |
[5] | Robert Bosch GmbH, (2004) Bosch Automotive Handbook, 6Eds., USA: Bentley Publishers. |
[6] | Heywood, J. B, (1988) Internal Combustion Engines Fundamentals. New York: McGraw-Hill Book Company. |
[7] | Pulkrabek, W. M, (2004) Engineering fundamentals of the Internal Combustion Engine. 2Eds., New Jersey: Pearson Prentice Hall. |
[8] | E3M-Lab National Technical University of Athens. Assessment of the implementation of a European alternative fuels strategy and possible supportive proposals. Project MOVE/C1/497-1-2011. August, 2012. Available from: http://ec.europa.eu/transport/themes/urban/studies/doc/2012-08-cts-implementation-study.pdf |
[9] | European Commission. "Clean Power for Transport: A European alternative fuels strategy". Available from: http://eur-lex.europa.eu/LexUriServ/LexUriServ.do?uri=COM:2013:0017:FIN:EN:PDF |
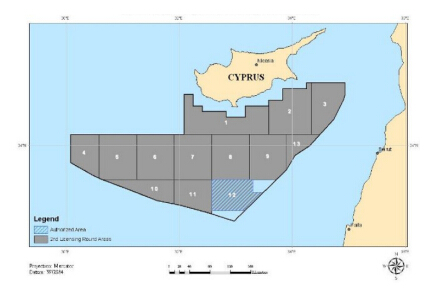
[10] | Government of the Republic of Cyprus. Notice from the Government of the Republic of Cyprus concerning Directive 94/22/EC of the European Parliament and of the Council on the conditions for granting and using authorisations for the prospection, exploration and production of hydrocarbons. Official Journal of the European Union. C38/24, 2012. |
[11] | Government of the Republic of Cyprus, Ministry of Commerce Industry and Tourism. "2nd Licensing round - hydrocarbon exploration". Available: http://www.mcit.gov.cy/mcit/mcit.nsf/dmlhcarbon_en/dmlhcarbon_en?OpenDocument. Cyprus, 2012. |
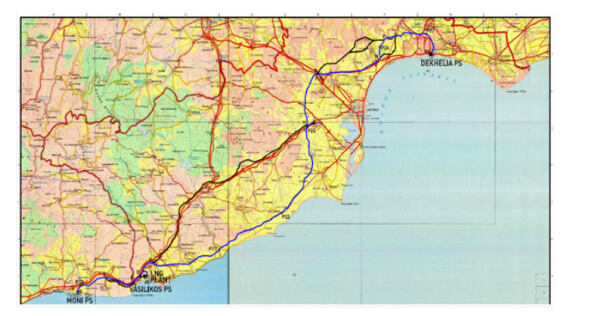
[12] | Natural Gas Public Company (DEFA). Projects: Construction of natural gas pipeline network. Available from: http://www.defa.com.cy/en/projects.html, Cyprus, 2013. |
[13] | European Commission, DG Energy. "Quarterly report on European Gas Markets". Volume 6, issue 1, First quarter, 2013. Available from: http://ec.europa.eu/energy/observatory/gas/doc/20130611_q1_quarterly_report_on_european_gas_markets.pdf |
[14] | European Commission. Emissions trading: Commission adopts decision on Cyprus' national allocation plan for 2008-2012. Press Release, IP-07-1131, Brussels, July 2007. Available from: http://europa.eu/rapid/press-release_IP-07-1131_en.htm |
[15] | European Commision. "The EU emission trading sytem EU ETS". Brussels, 2013. Available from: http://ec.europa.eu/clima/publications/docs/factsheet_ets_2013_en.pdf |
[16] | The European Energy Exchange (EEX). "Market data on Natural Gas Spot prices and trading volumes", Frankfurt, Germany, 2013. Available from: http://www.eex.com/en/EEX |
[17] | Statistical Service of the Cyprus Republic. "Statistical Themes: Energy, Environment". Available from: http://www.mof.gov.cy/mof/cystat/statistics.nsf/energy_environment_81main_gr/energy_environment_81main_gr?OpenForm&sub=1&sel=2 |
[18] | Chasos, C. A., Karagiorgis G. N. and Christodoulou, C. N. (2010) Utilisation of solar/thermal power plants for production of hydrogen with applications in the transportation sector. Proceedings of the 7th Mediterranean Conference and Exhibition on Power Generation, Transmission, Distribution and Energy Conversion (MEDPOWER 2010). Agia Napa, Cyprus, 7-10 November. |
[19] | Cyprus Organisation for Standardisation (CYS) (2008) CYS EN ISO 15403-1:2008: Natural gas — Natural gas for use as compressed fuel for vehicles — Part 1: Designation of the quality. |
1. | Celestine A. Udie, Agnes A. Anuka, Ekpenyong A. Ana, 2021, Alternative Energy Values in Natural Gasfractionation, 10.2118/207187-MS | |
2. | Michael M. Aba, Nilton Bispo Amado, Rodrigues Lemes Alcantaro, Ildo Luís Sauer, Abraham-A M. Richardson, Energy transition pathways for the Nigerian Road Transport: Implication for energy carrier, Powertrain technology, and CO2 emission, 2023, 23525509, 10.1016/j.spc.2023.03.019 |
Fuel | Fuel Quantity imported in tons | ||
2007 | 2008 | 2009 | |
Unleaded gasoline 95RON | 313, 535 | 334, 079 | 343, 907 |
Unleaded gasoline 98RON | 38, 317 | 38, 597 | 39, 561 |
Diesel(gas oil low sulphur) | 350, 037 | 365, 982 | 348, 841 |
All fossil fuels | 2985, 841 | 3086, 409 | 2936, 121 |
Vehicle type | Number of registered passenger vehicles |
Petrol ICE | 402, 435 |
Diesel ICE | 40, 248 |
Electric | 834 |
Total | 443, 517 |
Activity | Yearly amount of CO2 emissions(thous and tons) | |
2006 | 2007 | |
Transportation | 2053.63 | 2193.70 |
All | 8025.12 | 8167.26 |
Parameter | Value |
Quantity of imported gasoline for the base year(Kg) | 350 million |
LHV of gasoline for ICE(KJ/Kg) | 44, 000 |
LHV of natural gas(KJ/Kg) | 50, 000 |
Thermal efficiency of gasoline ICE(%) | 25 |
Thermal efficiency of natural gas ICE(%) | 25 |
Parameter | Value |
Cost of the natural gas fuelling station | 300, 000 Euro |
Number of new stations | 100 |
Cost for the installation of the natural gas piping network | 750, 000 Euro/Km |
Length of piping network | 300 Km |
Natural gas spot price | 26 Euro/MWh |
EU emission allowance price | 10 Euro/t CO2 |
j | Engine speed | Engine load(%) | Pb,j(KW) | Vav,j(Km/h) | fj |
1 | Idle | 0 | 0.5 | 5 | 0.083 |
2 | Speed of maximum torque | 10 | 2.2 | 10.8 | 0.08 |
3 | Speed of maximum torque | 25 | 5.5 | 27 | 0.08 |
4 | Speed of maximum torque | 50 | 11 | 54 | 0.08 |
5 | Speed of maximum torque | 75 | 16.5 | 81 | 0.08 |
6 | Speed of maximum torque | 100 | 22 | 108 | 0.25 |
7 | Idle | 0 | 0.5 | 5 | 0.083 |
8 | Speed of maximum power | 100 | 60.3 | 120 | 0.1 |
9 | Speed of maximum power | 75 | 45.2 | 90 | 0.02 |
10 | Speed of maximum power | 50 | 30.1 | 60 | 0.02 |
11 | Speed of maximum power | 25 | 15.1 | 30 | 0.02 |
12 | Speed of maximum power | 10 | 6 | 12 | 0.02 |
13 | Idle | 0 | 0.5 | 5 | 0.083 |