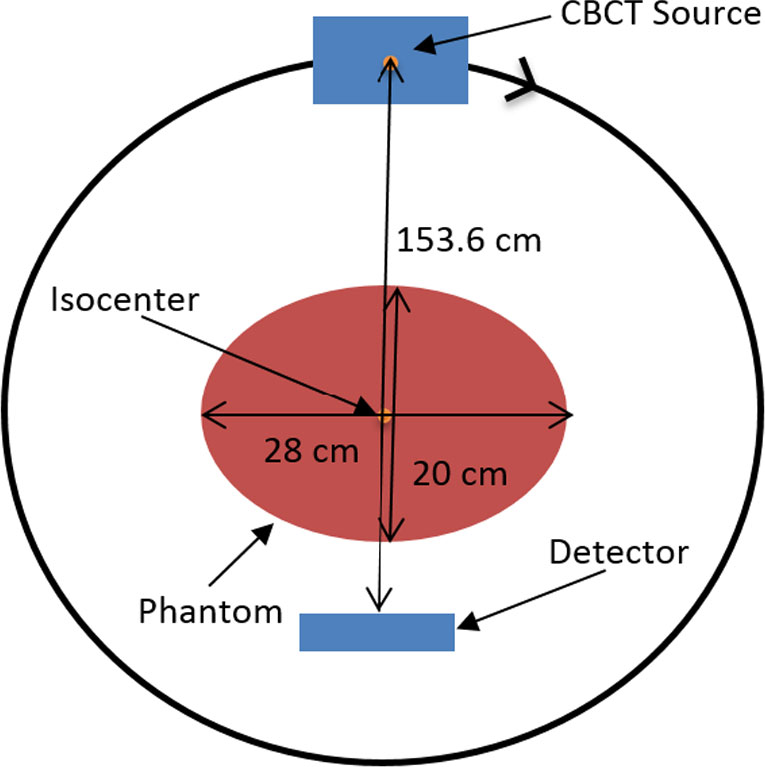
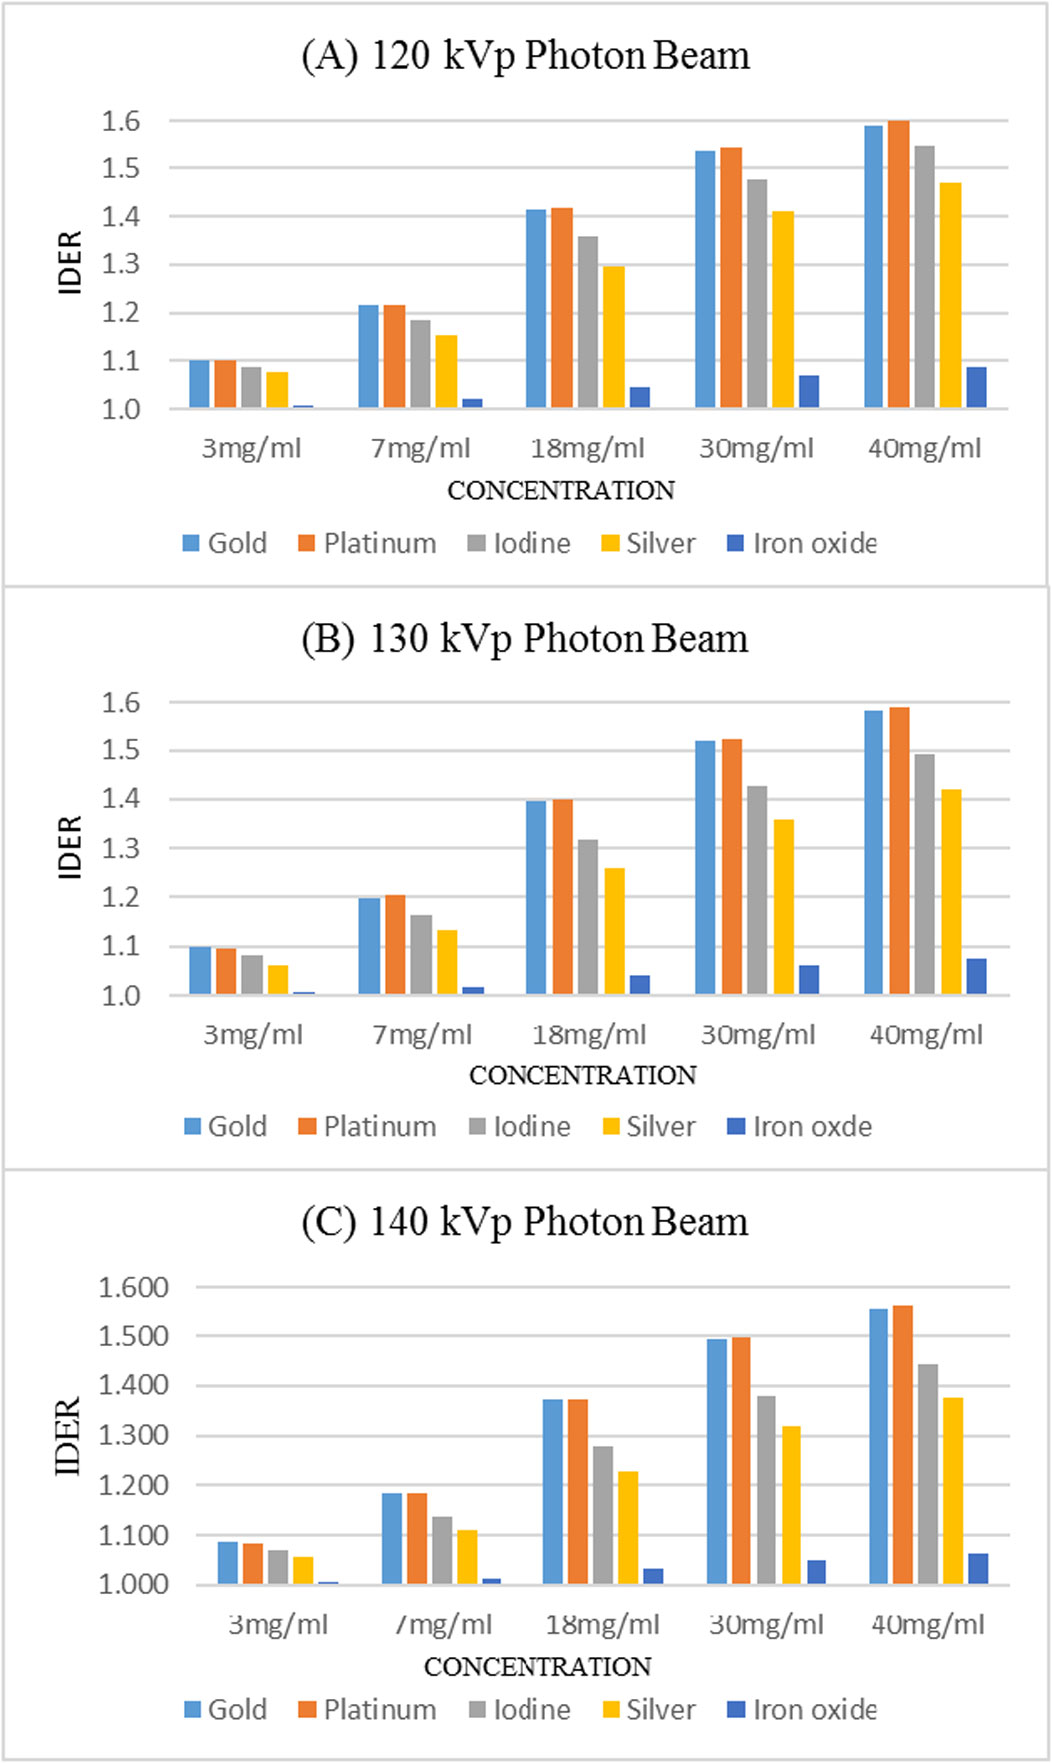
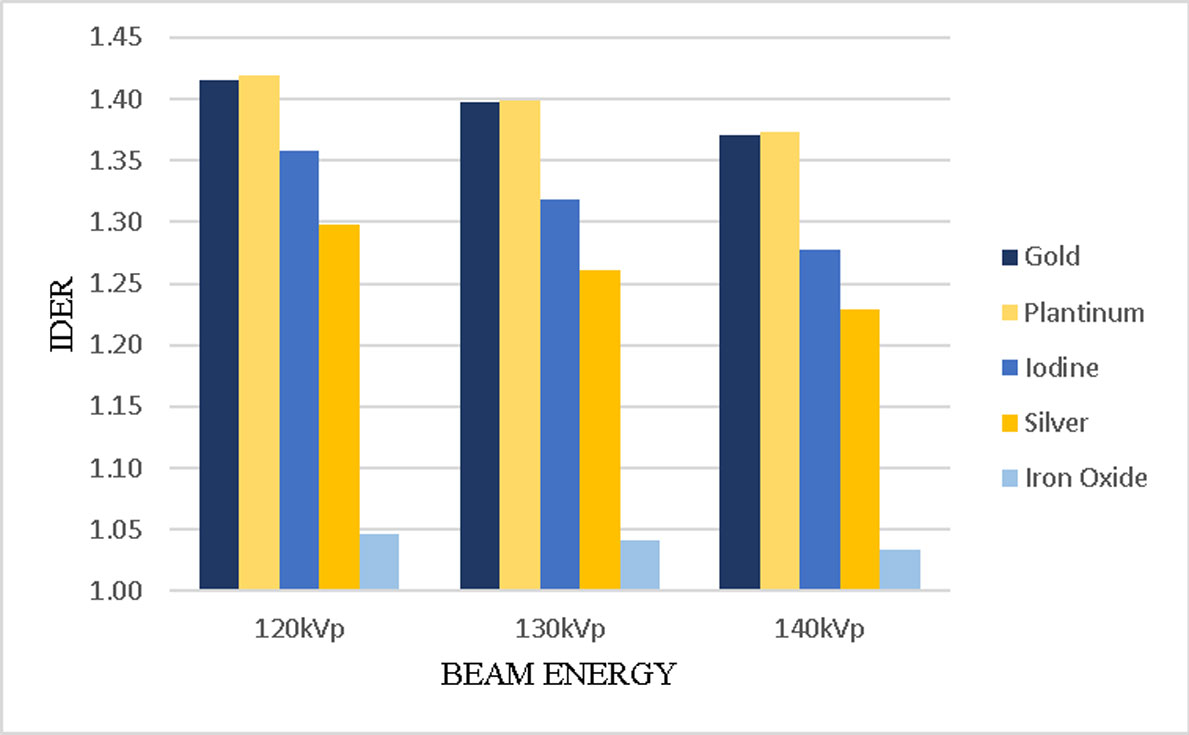
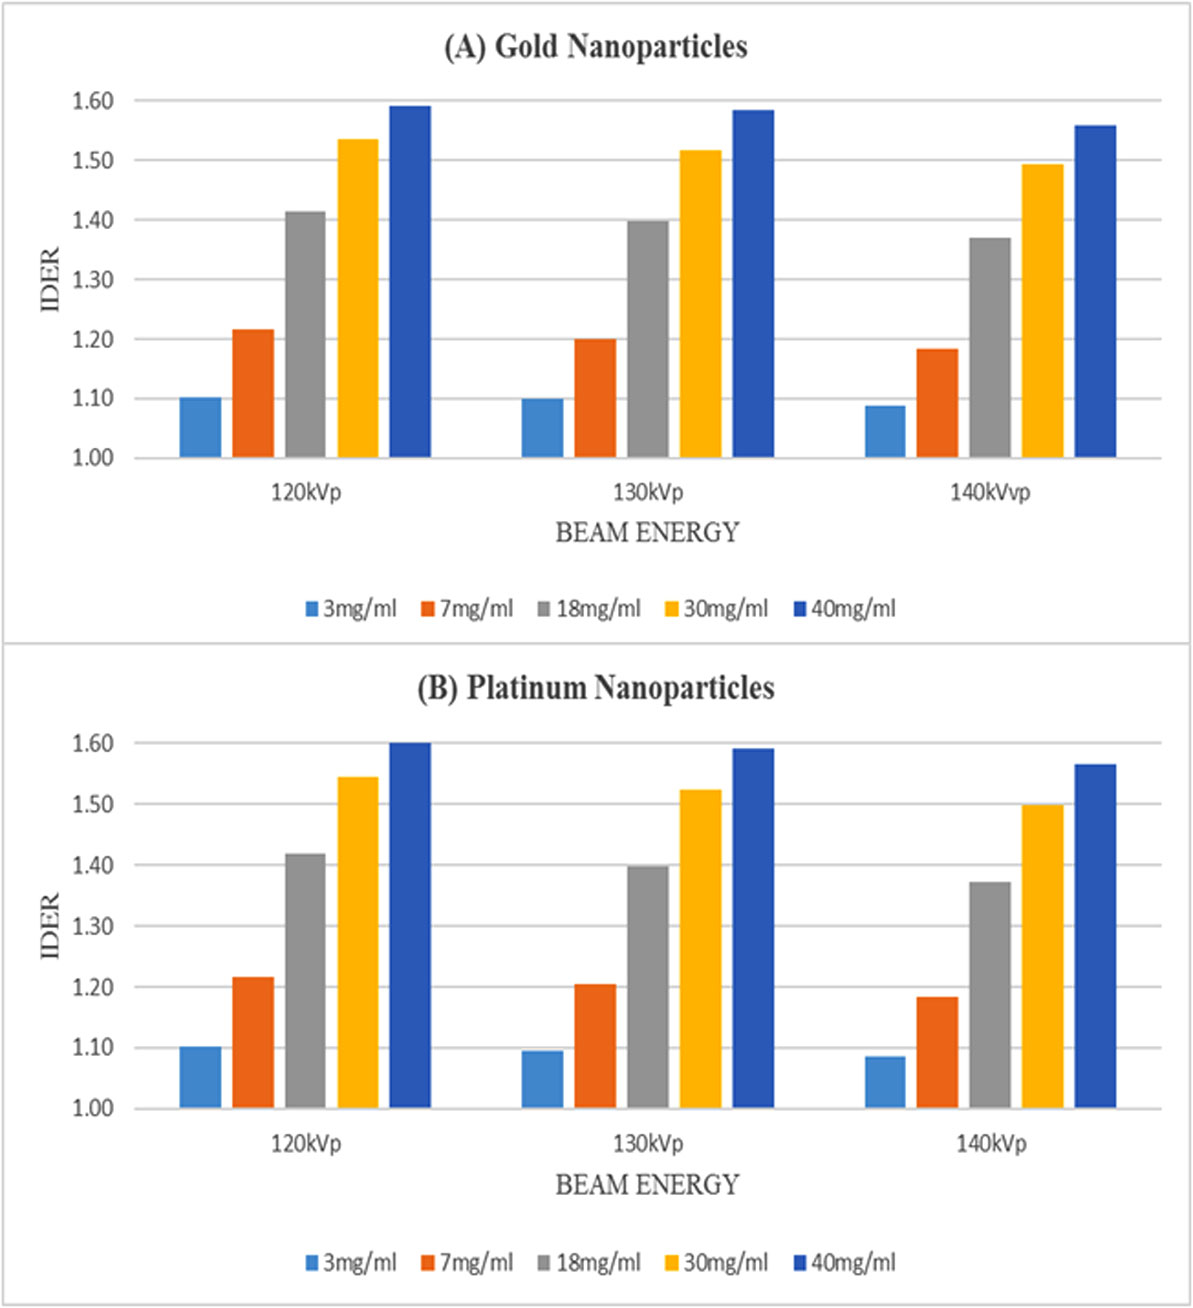
Using kilovoltage cone-beam computed tomography (kV-CBCT) and heavy-atom radiosensitizers in image-guided radiotherapy (IGRT) can provide numerous benefits, such as image contrast enhancement in radiation dose delivery. However, the increased use of kV-CBCT for daily imaging procedures may inevitably deposit certain amount of radiation dose to the patient, especially when nanoparticles used as radiosensitizers are involved. In this study, we use Monte Carlo simulation to evaluate the imaging dose escalation due to nanoparticle addition with varying nanoparticle material, nanoparticle concentration and photon beam energy. A phantom was used to determine the relationships between the imaging dose enhancement ratios (IDERs) and different concentrations (3–40 mg/ml) of gold (Au), platinum (Pt), iodine (I), silver (Ag) and iron oxide (Fe2O3) nanoparticles, under the delivery of 120–140 kVp photon beams from the CBCT. It is found that gold and platinum nanoparticles of 40 mg/ml concentration had the highest IDER (∼1.6) under the 120 kVp photon beam. This nanoparticle addition resulted in a 0.63% increase of imaging dose based on a typical dose prescription of 200 cGy per fraction in radiotherapy, and is within the standard uncertainty of ±5% in radiation dose delivery. This study proves that the incorporation of higher concentration nanoparticles under lower photon beam energy could increase the imaging dose. The results from this study can enable us to understand more about the incorporation of heavy-atom nanoparticles in IGRT systems.
Citation: Dewmini Mututantri-Bastiyange, James C. L. Chow. Imaging dose of cone-beam computed tomography in nanoparticle-enhanced image-guided radiotherapy: A Monte Carlo phantom study[J]. AIMS Bioengineering, 2020, 7(1): 1-11. doi: 10.3934/bioeng.2020001
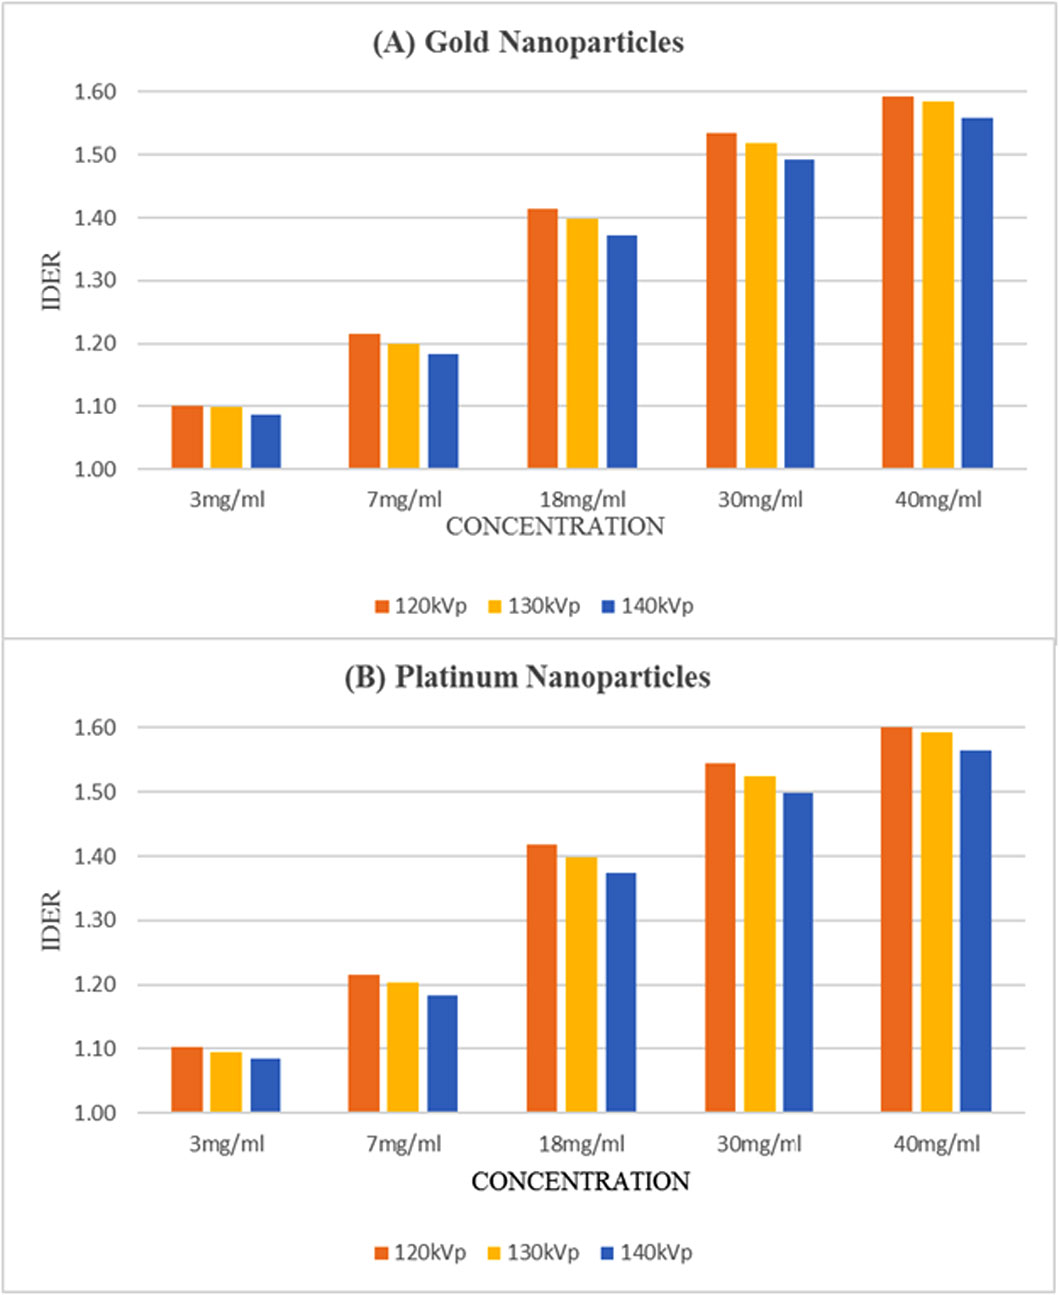
Using kilovoltage cone-beam computed tomography (kV-CBCT) and heavy-atom radiosensitizers in image-guided radiotherapy (IGRT) can provide numerous benefits, such as image contrast enhancement in radiation dose delivery. However, the increased use of kV-CBCT for daily imaging procedures may inevitably deposit certain amount of radiation dose to the patient, especially when nanoparticles used as radiosensitizers are involved. In this study, we use Monte Carlo simulation to evaluate the imaging dose escalation due to nanoparticle addition with varying nanoparticle material, nanoparticle concentration and photon beam energy. A phantom was used to determine the relationships between the imaging dose enhancement ratios (IDERs) and different concentrations (3–40 mg/ml) of gold (Au), platinum (Pt), iodine (I), silver (Ag) and iron oxide (Fe2O3) nanoparticles, under the delivery of 120–140 kVp photon beams from the CBCT. It is found that gold and platinum nanoparticles of 40 mg/ml concentration had the highest IDER (∼1.6) under the 120 kVp photon beam. This nanoparticle addition resulted in a 0.63% increase of imaging dose based on a typical dose prescription of 200 cGy per fraction in radiotherapy, and is within the standard uncertainty of ±5% in radiation dose delivery. This study proves that the incorporation of higher concentration nanoparticles under lower photon beam energy could increase the imaging dose. The results from this study can enable us to understand more about the incorporation of heavy-atom nanoparticles in IGRT systems.

| [1] |
Zubizarreta E, Van Dyk J, Lievens Y (2017) Analysis of global radiotherapy needs and costs by geographic region and income level. Clin Oncol 29: 84-92. doi: 10.1016/j.clon.2016.11.011

|
| [2] |
He C, Chow JCL (2016) Gold nanoparticle DNA damage in radiotherapy: A Monte Carlo study. AIMS Bioeng 3: 352-361. doi: 10.3934/bioeng.2016.3.352
|
| [3] |
Berbeco RI, Korideck H, Ngwa W, et al. (2012) DNA damage enhancement from gold nanoparticles for clinical MV photon beams. Radiat Res 178: 604-608. doi: 10.1667/RR3001.1
|
| [4] |
Boudaïffa B, Cloutier P, Hunting D, et al. (2000) Resonant formation of DNA strand breaks by low-energy (3 to 20 eV) electrons. Sci 287: 1658-1660. doi: 10.1126/science.287.5458.1658
|
| [5] |
Killoran JH, Kooy HM, Gladstone DJ, et al. (1997) A numerical simulation of organ motion and daily setup uncertainties: implications for radiation therapy. Int J Radiat Oncol Biol Phys 37: 213-221. doi: 10.1016/S0360-3016(96)00477-4
|
| [6] |
Jaffray DA, Siewerdsen JH, Wong JW, et al. (2002) Flat-panel cone-beam computed tomography for image-guided radiation therapy. Int J Radiat Oncol Biol Phys 53: 1337-1349. doi: 10.1016/S0360-3016(02)02884-5
|
| [7] |
Groh BA, Siewerdsen JH, Drake DG, et al. (2002) A performance comparison of flat-panel imager-based MV and kV cone-beam CT. Med Phys 29: 967-975. doi: 10.1118/1.1477234
|
| [8] |
Jaffray DA (2012) Image-guided radiotherapy: from current concept to future perspectives. Nat Rev Clin Oncol 9: 688-699. doi: 10.1038/nrclinonc.2012.194
|
| [9] |
Chen GTY, Sharp GC, Mori S (2009) A review of image-guided radiotherapy. Radiol Phys Tech 2: 1-12. doi: 10.1007/s12194-008-0045-y
|
| [10] |
van der Meer S, Bloemen-van Gurp E, Hermans J, et al. (2013) Critical assessment of intramodality 3D ultrasound imaging for prostate IGRT compared to fiducial markers. Med Phys 40: 071707. doi: 10.1118/1.4808359
|
| [11] |
Boda-Heggemann J, Lohr F, Wenz F, et al. (2011) kV cone-beam CT-based IGRT. Strahlenther Onkol 187: 284-291. doi: 10.1007/s00066-011-2236-4
|
| [12] |
Abdulle A, Chow JCL (2019) Contrast enhancement for portal imaging in nanoparticle-enhanced radiotherapy: A Monte Carlo phantom evaluation using flattening-filter-free photon beams. Nanomaterials 9: 920. doi: 10.3390/nano9070920
|
| [13] |
Nagesha DK, Tada DB, Stambaugh CKK, et al. (2010) Radiosensitizer-eluting nanocoatings on gold fiducials for biological in-situ image-guided radio therapy (BIS-IGRT). Phys Med Biol 55: 6039. doi: 10.1088/0031-9155/55/20/001
|
| [14] |
Chow JCL (2018) Recent progress in Monte Carlo simulation on gold nanoparticle radiosensitization. AIMS Biophys 5: 231-244. doi: 10.3934/biophy.2018.4.231
|
| [15] | Chow JCL (2017) Application of nanoparticle materials in radiation therapy. Handbook of Ecomaterials Switzerland: Springer, 1-21. |
| [16] | Chow JCL (2018) Monte Carlo nanodosimetry in gold nanoparticle-enhanced radiotherapy. Recent Advancements and Applications in Dosimetry New York: Nova Science Publishers. |
| [17] | Reuveni T, Motiei M, Romman Z, et al. (2011) Targeted gold nanoparticles enable molecular CT imaging of cancer: an in vivo study. Int J Nanomed 6: 2859-2864. |
| [18] |
Hepel M, Stobiecka M (2012) Detection of oxidative stress biomarkers using functional gold nanoparticles. Fine Particles in Medicine and Pharmacy Boston: Springer, 241-281. doi: 10.1007/978-1-4614-0379-1_9
|
| [19] |
Stobiecka M, Ratajczak K, Jakiela S (2019) Toward early cancer detection: Focus on biosensing systems and biosensors for an anti-apoptotic protein survivin and survivin mRNA. Biosens Bioelectron 137: 58-71. doi: 10.1016/j.bios.2019.04.060
|
| [20] |
Leung MKK, Chow JCL, Chithrani BD, et al. (2011) Irradiation of gold nanoparticles by x-rays: Monte Carlo simulation of dose enhancements and the spatial properties of the secondary electrons production. Med Phys 38: 624-631. doi: 10.1118/1.3539623
|
| [21] |
Bertelsen A, Schytte T, Bentzen SM, et al. (2011) Radiation dose response of normal lung assessed by Cone Beam CT–a potential tool for biologically adaptive radiation therapy. Radiother Oncol 100: 351-355. doi: 10.1016/j.radonc.2011.08.012
|
| [22] |
Stock M, Palm A, Altendorfer A, et al. (2012) IGRT induced dose burden for a variety of imaging protocols at two different anatomical sites. Radiother Oncol 102: 355-363. doi: 10.1016/j.radonc.2011.10.005
|
| [23] |
Chow JCL, Leung MKK, Islam MK, et al. (2008) Evaluation of the effect of patient dose from cone beam computed tomography on prostate IMRT using Monte Carlo simulation. Med Phys 35: 52-60. doi: 10.1118/1.2815625
|
| [24] |
Chow JCL (2009) Cone-beam CT dosimetry for the positional variation in isocenter: A Monte Carlo study. Med Phys 36: 3512-3520. doi: 10.1118/1.3166934
|
| [25] |
Jia X, Yan H, Gu X, et al. (2012) Fast Monte Carlo simulation for patient-specific CT/CBCT imaging dose calculation. Phys Med Biol 57: 577. doi: 10.1088/0031-9155/57/3/577
|
| [26] | Kawrakow I (2001) The EGSnrc code system, Monte Carlo simulation of electron and photon transport. NRCC Report Pirs-701. |
| [27] | Rogers DWO, Walters B, Kawrakow I (2009) BEAMnrc Users Manual. NRCC Report Pirs-509. |
| [28] | Walters B, Kawrakow I, Rogers DWO (2005) DOSXYZnrc Users Manual. NRCC Report Pirs-794. |
| [29] |
Ding GX, Coffey CW (2010) Beam characteristics and radiation output of a kilovoltage cone-beam CT. Phys Med Biol 55: 5231-5248. doi: 10.1088/0031-9155/55/17/022
|
| [30] |
Albayedh F, Chow JCL (2018) Monte Carlo simulation on the imaging contrast enhancement in nanoparticle-enhanced radiotherapy. J Med Phys 43: 195-199. doi: 10.4103/jmp.JMP_141_17
|
| [31] |
Chow JCL (2016) Photon and electron interactions with gold nanoparticles: A Monte Carlo study on gold nanoparticle-enhanced radiotherapy. Nanobiomater Med Imaging 8: 45-70. doi: 10.1016/B978-0-323-41736-5.00002-9
|
| [32] |
Alaei P, Spezi E (2015) Imaging dose from cone beam computed tomography in radiation therapy. Phys Med 31: 647-658. doi: 10.1016/j.ejmp.2015.06.003
|
| [33] |
Brahme A (1988) Accuracy requirements and quality assurance of external beam therapy with photons and electrons. Acta Oncol 27: 1-76. doi: 10.3109/02841868809105001
|
| [34] |
Schuemann J, Berbeco R, Chithrani DB, et al. (2016) Roadmap to clinical use of gold nanoparticles for radiation sensitization. Int J Radiation Oncol Biol Phys 94: 189-205. doi: 10.1016/j.ijrobp.2015.09.032
|
| [35] |
Hainfeld JF, Slatkin DN, Focella TM, et al. (2006) Gold nanoparticles: a new X-ray contrast agent. Br J Radiol 79: 248-253. doi: 10.1259/bjr/13169882
|
| [36] |
Casanelli B, Santibáñez M, Valente M (2020) Particle size effect on fluorescence emission for Au-infused soft tissues. Rad Phys Chem 167: 108302. doi: 10.1016/j.radphyschem.2019.04.052
|
Figures(5)

Dewmini Mututantri-Bastiyange, James C. L. Chow. Imaging dose of cone-beam computed tomography in nanoparticle-enhanced image-guided radiotherapy: A Monte Carlo phantom study[J]. AIMS Bioengineering, 2020, 7(1): 1-11. doi: 10.3934/bioeng.2020001


 DownLoad: