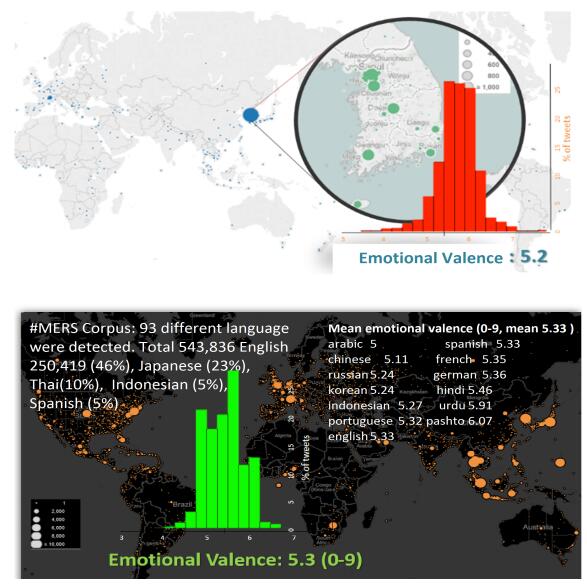
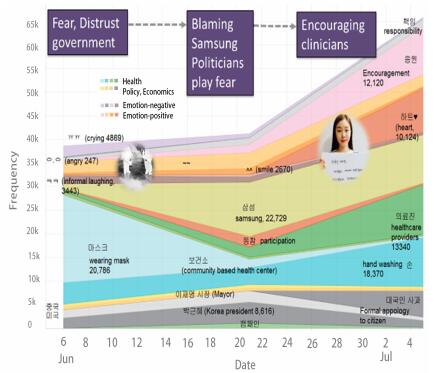
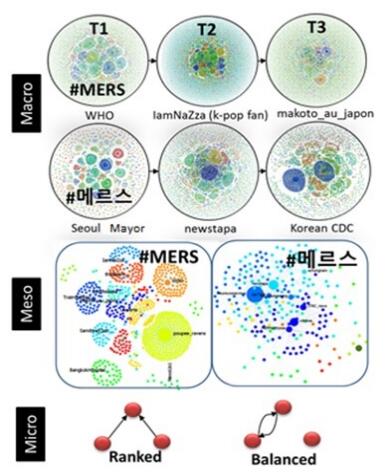
Middle East Respiratory Syndrome (MERS, 메르스 in Korean) is an emerging deadly viral respiratory disease with no treatment. This study applied a triangulation approach of quantitative structure and content mining techniques while incorporating qualitative approaches guided by domain experts, to understand #MERS and #메르스 tweets. This study sought to gain insights about culturally-appropriate nursing activities for an emerging global acute disease management.
Citation: Sunmoo Yoona, Da Kuang, Peter Broadwell, Haeyoung Lee, Michelle Odlum. What can we learn about the Middle East Respiratory Syndrome (MERS) outbreak from tweets?[J]. Big Data and Information Analytics, 2017, 2(3): 203-207. doi: 10.3934/bdia.2017013
Middle East Respiratory Syndrome (MERS, 메르스 in Korean) is an emerging deadly viral respiratory disease with no treatment. This study applied a triangulation approach of quantitative structure and content mining techniques while incorporating qualitative approaches guided by domain experts, to understand #MERS and #메르스 tweets. This study sought to gain insights about culturally-appropriate nursing activities for an emerging global acute disease management.

| [1] | D. M. Blei, A. Y. Ng and M. I. Jordan, Latent dirichlet allocation, Journal of machine Learning research, 3 (2003), 993-1022. |
| [2] | P. S. Dodds, K. D. Harris, I. M. Kloumann, C. A. Bliss and C. M. Danforth, Temporal patterns of happiness and information in a global social network: Hedonometrics and twitter, PloS one, 6 (2011), e26752. |
| [3] | J. Fawcett and C. H. Ellenbecker, A proposed conceptual model of nursing and population health, Nursing outlook, 63 (2015), 288-298. |
| [4] | D. Kuang and H. Park, Fast rank-2 nonnegative matrix factorization for hierarchical document clustering, in Proceedings of the 19th ACM SIGKDD international conference on Knowledge discovery and data mining, ACM, 2013,739-747. |
| [5] | M. Lui and T. Baldwin, Cross-domain feature selection for language identification, in Proceedings of 5th International Joint Conference on Natural Language Processing, Citeseer, 2011. |
| [6] | S. Yoon and S. Bakken, Methods of knowledge discovery in tweets, in NI 2012: Proceedings of the 11th International Congress on Nursing Informatics, vol. 2012, American Medical Informatics Association, 2012. |
Figures(3)

Sunmoo Yoona, Da Kuang, Peter Broadwell, Haeyoung Lee, Michelle Odlum. What can we learn about the Middle East Respiratory Syndrome (MERS) outbreak from tweets?[J]. Big Data and Information Analytics, 2017, 2(3): 203-207. doi: 10.3934/bdia.2017013


 DownLoad: