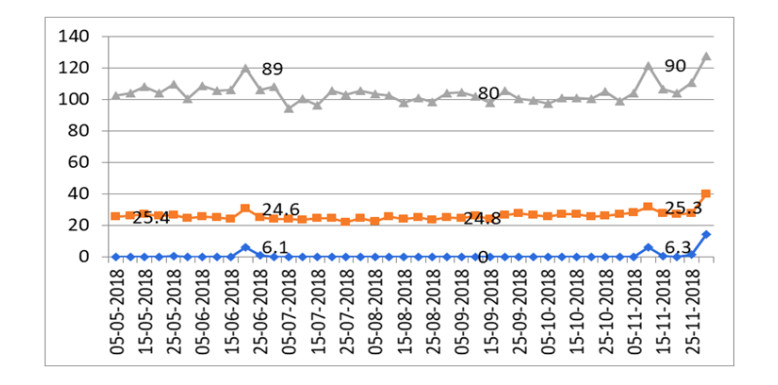
The use of varieties that are able to adapt well to extreme environments is one strategy to overcome the challenges of decreasing production in sub-optimal land. Indonesian tropical rice varieties (Jatiluhur, IPB 9G, IPB 3S, Hipa 19, Mentik Wangi, Ciherang, Inpari 17, and Mekongga) have been tested and established as water-used-efficient varieties in an optimal environment. However, to date, these varieties have not been examined in the suboptimal area, in particular, drought stress conditions. Therefore, this study aimed to evaluate the adaptation response of production, morphological, and physiological character of several water-efficient rice varieties under drought stress in the field. The study was designed in a split-plot with two factors and 4 replications, where the first factor (main plot) was drought stress stages i.e. vegetative (Dv), reproductive (Dr), generative (Dg), and control (Dc). The second factor was rice varieties, consisting of eight varieties, i.e., Jatiluhur, IPB 3S, IPB 9G, Hipa 19, Mentik Wangi, Ciherang, Inpari 17, and Mekongga. The experiment was conducted from May to December 2018 in Muneng Kidul Village, Probolinggo Regency, East Java Province. The experimental variables were morphology, production, leaf scrolling score during drought stress, drought sensitivity index, water use efficiency, physiology and root anatomy. The result showed that upland rice varieties were more tolerant to drought stress and had a higher water use efficiency than lowland rice varieties. This shows that Jatiluhur and IPB 9G which are indicated to be adaptive to drought stress, and have the ability to regulate water use more efficiently when drought stress occurs. Therefore, water use efficiency could be used as selection characters under drought conditions in rice particularly tropical upland rice. Moreover, morphological characters, i.e., grain yiled per plot, weight of pithy grain, weight of shoot biomass and weight of roots could be the selection characters to predict drought tolerant tropical rice. According to physiological characters, photosynthesis rate, transpiration rate, proline content, malondialdehyde content, leaf water potential and leaf greenness could be used as a selection tool to predict water use efficient genotypes in rice. However, further studies are needed to understand the complex mechanisms of water use efficiency by combining various approaches.
Citation: Didi Darmadi, Ahmad Junaedi, Didy Sopandie, Supijatno, Iskandar Lubis, Koki Homma. Water-efficient rice performances under drought stress conditions[J]. AIMS Agriculture and Food, 2021, 6(3): 838-863. doi: 10.3934/agrfood.2021051
The use of varieties that are able to adapt well to extreme environments is one strategy to overcome the challenges of decreasing production in sub-optimal land. Indonesian tropical rice varieties (Jatiluhur, IPB 9G, IPB 3S, Hipa 19, Mentik Wangi, Ciherang, Inpari 17, and Mekongga) have been tested and established as water-used-efficient varieties in an optimal environment. However, to date, these varieties have not been examined in the suboptimal area, in particular, drought stress conditions. Therefore, this study aimed to evaluate the adaptation response of production, morphological, and physiological character of several water-efficient rice varieties under drought stress in the field. The study was designed in a split-plot with two factors and 4 replications, where the first factor (main plot) was drought stress stages i.e. vegetative (Dv), reproductive (Dr), generative (Dg), and control (Dc). The second factor was rice varieties, consisting of eight varieties, i.e., Jatiluhur, IPB 3S, IPB 9G, Hipa 19, Mentik Wangi, Ciherang, Inpari 17, and Mekongga. The experiment was conducted from May to December 2018 in Muneng Kidul Village, Probolinggo Regency, East Java Province. The experimental variables were morphology, production, leaf scrolling score during drought stress, drought sensitivity index, water use efficiency, physiology and root anatomy. The result showed that upland rice varieties were more tolerant to drought stress and had a higher water use efficiency than lowland rice varieties. This shows that Jatiluhur and IPB 9G which are indicated to be adaptive to drought stress, and have the ability to regulate water use more efficiently when drought stress occurs. Therefore, water use efficiency could be used as selection characters under drought conditions in rice particularly tropical upland rice. Moreover, morphological characters, i.e., grain yiled per plot, weight of pithy grain, weight of shoot biomass and weight of roots could be the selection characters to predict drought tolerant tropical rice. According to physiological characters, photosynthesis rate, transpiration rate, proline content, malondialdehyde content, leaf water potential and leaf greenness could be used as a selection tool to predict water use efficient genotypes in rice. However, further studies are needed to understand the complex mechanisms of water use efficiency by combining various approaches.

| [1] | BPS (2021) Berita Resmi Statistik, 45. |
| [2] |
Khairullah I, Alwi M, Annisa W, et al. (2021) The fluctuation of rice production of tidal swampland on climate change condition (Case of South Kalimantan Province in Indonesia. IOP Conf Ser Earth Environ Sci 724: 1-7. doi: 10.1088/1755-1315/724/1/012009

|
| [3] | FAO (2021) Programmes and projects FAO in Indonesia. |
| [4] | Levitt J (1980) Responses of plants to environmental stresses. Water, Radiation, Salt, and Other Stresses, 607. |
| [5] | Bramley H, Turner NC, Siddique KHM (2013) Genomics and Breeding for Climate-Resilient Crops, In: Chittaranjan K (Ed.), Genomics and breeding for climate-resilient crops: Vol. 2 target traits, Springer, 225-268. |
| [6] | Supijatno, Chozin MA, Sopandie D, et al. (2012) Water consumption evaluation among rice genotypes showing possibility to explore benefit of water use efficiency. J Agron Indones 40: 15-20. |
| [7] | Sulistyono E, Ramdiani Y (2005) The deficit of evatranspiration as an indocator of water deficit on upland (Oryza sativa L). J Agron Indones (Indonesian J Agron) 33: 6-11. |
| [8] |
Hu H, Xiong L (2014) Genetic engineering and breeding of drought-resistant crops. Annu Rev Plant Biol 65: 715-41. doi: 10.1146/annurev-arplant-050213-040000
|
| [9] |
Wopereis MCS, Kropff MJ, Maligaya AR, et al. (1996) Drought-stress responses of two lowland rice cultivars to soil water status. Crop Res 46: 21-39. doi: 10.1016/0378-4290(95)00084-4
|
| [10] | Tubur HW, Chozin MA, Santosa E, et al. (2012) Agronomic responses of low land rice varieties to drought periods. J Agron Indones (Indonesian J Agron) 40: 167-73. |
| [11] |
Herawati R, Masdar, Ganefianti DW, et al. (2017) Screening and identification of upland rice lines derived recurrent selection for drought tolerance. Int J Adv Sci Eng Inf Technol 7: 2322-7. doi: 10.18517/ijaseit.7.6.2955
|
| [12] |
Krieger-Liszkay A, Krupinska K, Shimakawa G (2019) The impact of photosynthesis on initiation of leaf senescence. Physiol Plant 166: 148-64. doi: 10.1111/ppl.12921
|
| [13] | Akbar MR, Purwoko BS, Dewi IS (2018) Agronomic and drought tolerance evaluation of doubled haploid rice breeding lines derived from anther culture. Sabrao J Breed Genet 50: 115-28. |
| [14] |
Kamarudin ZS, Yusop MR, Mohamed MT, et al. (2018) Growth performance and antioxidant enzyme activities of advanced mutant rice genotypes under drought stress condition. Agronomy 8: 1-15. doi: 10.3390/agronomy8120279
|
| [15] | Lawas LMF, Li X, Erban A, Kopka J, et al. (2019) Metabolic responses of rice cultivars with different tolerance to combined drought and heat stress under field conditions. Gigascience 8: 1-21. |
| [16] | Yang X, Wang B, Chen L, et al. (2019) The different influences of drought stress at the flowering stage on rice physiological traits, grain yield, and quality. Sci Rep 9: 1-12. |
| [17] | Anshori MF, Purwoko BS, Dewi IS, et al. (2018) Determination of selection criteria for screening of rice genotypes for salinity tolerance. Sabrao J Breed Genet 50: 279-94. |
| [18] | Fischer RA, Maurer R (1978) Drought resistance in spring wheat cultivars. I. Grain yield responses. Aust J Agric Res 29: 897-912. |
| [19] |
Darmadi D, Junaedi A, Sopandie D, et al. (2019) Evaluation of water-saving rice status based on morphophysiological characteristics and water use efficiency. Biodiversitas 20: 2815-2823. doi: 10.13057/biodiv/d201006
|
| [20] |
Sims DA, Gamon JA (2002) Relationships between leaf pigment content and spectral reflectance across a wide range of species, leaf structures and developmental stages. Remote Sens Environ 81: 337-54. doi: 10.1016/S0034-4257(02)00010-X
|
| [21] |
Bates LS, Waldren RP, Teare ID (1973) Short communication : rapid determination of free proline for water-stress studies. Plant Soil 39: 205-7. doi: 10.1007/BF00018060
|
| [22] |
Wang YS, Ding M Di, Gu XG, et al. (2013) Analysis of interfering substances in the measurement of malondialdehyde content in plant leaves. Am J Biochem Biotechnol 9: 235-242. doi: 10.3844/ajbbsp.2013.235.242
|
| [23] | Fischer EKS, Lafitte R, Fukai S, et al. (2003) Breeding rice for environments, 1-106. |
| [24] | Meriga B, Attitalla IH, Ramgopal M, et al. (2010) Differential tolerance to aluminium toxicity in rice cultivars: involvement of antioxidative enzymes and possible role of aluminium resistant locus. Acad J Plant Sci 3: 53-63. |
| [25] |
dos Santos CL, Reis AF de B, Mazzafera P, et al. (2018) Determination of the water potential threshold at which rice growth is impacted. Plants 7: 4-11. doi: 10.3390/plants7030048
|
| [26] | Deng X, Zhang HQ, Wang Y, et al. (2014) Mapped clone and functional analysis of leaf-color gene Ygl7 in a rice hybrid (Oryza sativa L. ssp. indica). PLoS One 9: 1-11. |
| [27] |
Deng P, Jiang D, Dong Y, et al. (2015) Physiological characterisation and fine mapping of a salt-tolerant mutant in rice (Oryza sativa). Funct Plant Biol 42: 1026-35. doi: 10.1071/FP15126
|
| [28] | Anyaoha CO, Uba U, Onotugoma E, et al. (2019) Farmers' Preferred Traits and Perceptions of Drought Stress on Rainfed Upland Rice Production across Two Rice Growing States of Nigeria. J Agric Stud 7: 160-175. |
| [29] | Satrio RD, Fendiyanto MH, Supena EDJ, et al. (2019) Identification of drought-responsive regulatory genes by hierarchical selection of expressed sequence tags and their expression under drought stress in rice. Int J Agric Biol 22: 1524-32. |
| [30] |
Ahmadikhah A, Marufinia A (2016) Effect of reduced plant height on drought tolerance in rice. 3 Biotech 6: 1-9. doi: 10.1007/s13205-016-0542-3
|
| [31] | Saxena NP, O'Toole J (2000) Field screening for drought tolerance in crop plants with emphasis on rice. 11-14 Dec 2000, ICRISAT, Patancheru, India. Patancheru 502 324, Andhra Pradesh, India, and the Rockefeller Foundation, New York, New York 10018-2702, USA, 208. |
| [32] |
Ding X, Li X, Xiong L (2013) Insight into differential responses of upland and paddy rice to drought stress by comparative expression profiling analysis. Int J Mol Sci 14: 5214-5238. doi: 10.3390/ijms14035214
|
| [33] | Afrianingsih S, Susanto U, Ardiarini NR (2018) Tolerance of rice genotype (Oryza sativa L.) on vegetative phase and generative phase to drought stress. J Produksi Tanam 6: 355-63. |
| [34] | Sopandie D (2013) Fisiologi Adaptasi tanaman terhadap cekaman abiotik pada ekosistem tropika, 227. |
| [35] | Nio SA, Torey P (2013) Root morphological characters as water-deficit indicators in plants. J Bios Logos 3: 30-39. |
| [36] | Torey PC, Ai NS, Siahaan P, et al. (2013) Root-morphological characters as water-deficit indicators in local rice Superwin) Patricia. J Bios Logos 3: 57-64. |
| [37] |
Hochholdinger F, Yu P, Marcon C (2018) Genetic Control of Root System Development in Maize. Trends Plant Sci 23: 79-88. doi: 10.1016/j.tplants.2017.10.004
|
| [38] |
Yue B, Xiong L, Xue W, et al. (2005) Genetic analysis for drought resistance of rice at reproductive stage in field with different types of soil. Theor Appl Genet 111: 1127-1136. doi: 10.1007/s00122-005-0040-1
|
| [39] | Abd Allah AA, Badawy SA, Zayed BA, et al. (2011) The role of root system traits in the drought tolerance of rice (Oryza sativa L.). World Acad Sci Eng Technol 80: 700-704. |
| [40] | Guimarães CM, Stone LF, Rangel PHN, et al. (2013) Tolerance of upland rice genotypes to water deficit [Tolerâ ncia à deficiência hídrica de genótipos de arroz de terras altas]. Rev Bras Eng Agric e Ambient 17: 805-810. |
| [41] | Maisura, Chozin M., Lubis I, et al. (2014) Some physiological character responses of rice under drought conditions in a paddy system. J Int Soc Southeast Asian Agric Sci 104-114. |
| [42] |
Wang Y, Wang L, Zhou J, et al. (2019) Research progress on heat stress of rice at flowering stage. Rice Sci 26: 1-10. doi: 10.1016/j.rsci.2018.06.009
|
| [43] |
Jaisyurahman U, Wirnas D, Purnamawati H (2019) Effect of High-Temperature Conditions to Rice Growing and Yield. J Agron Indones 47: 248-254. doi: 10.24831/jai.v47i3.24892
|
| [44] | Jagadish SVK, Craufurd PQ, Wheeler TR (2007) High temperature stress and spikelet fertility in rice (Oryza sativa L.). J Exp Bot 58: 1627-1635. |
| [45] |
Peng S, Huang J, Sheehy JE. (2004). Rice yields decline with higher night temperature from global warming. Proc Natl Acad Sci U S A 101: 9971-9975. doi: 10.1073/pnas.0403720101
|
| [46] | Rasel M, Tahjib-Ul-Arif M, Hossain MA, et al. (2019) Discerning of rice landraces (Oryza sativa L.) for morpho-physiological, antioxidant enzyme activity, and molecular markers' responses to induced salt stress at the seedling stage. J Plant Growth Regul 1-19. |
| [47] |
Larkunthod P, Nounjan N, Siangliw JL, et al. (2018) Physiological responses under drought stress of improved drought- Tolerant rice lines and their parents. Not Bot Horti Agrobot Cluj-Napoca 46: 679-687. doi: 10.15835/nbha46211188
|
| [48] | Akram HM, Ali A, Sattar A, et al. (2013) Impact of water deficit stress on various physiological and agronomic traits of three Basmati rice (Oryza sativa L.) cultivars. J Anim Plant Sci 23: 1415-1423. |
| [49] | Oukarroum A, Madidi S El, Schansker G, et al. (2007) Probing the responses of barley cultivars (Hordeum vulgare L.) by chlorophyll a fluorescence OLKJIP under drought stress and re-watering. Environ Exp Bot 60: 438-446. |
| [50] | Chipojola F, Mwase W, Kwapata M, et al. (2002) Morphological characterization of cashew (Anacardium occidentale L.) in four populations in Malawi. African J Biotechnol 8: 5173-5181. |
| [51] |
Bezerra AA de C, Anunciação Filho CJ da, Freire Filho FR, et al. (2001) Inter-relação entre caracteres de caupi de porte ereto e crescimento determinado. Pesqui Agropecuária Bras 36: 137-142. doi: 10.1590/S0100-204X2001000100017
|
| [52] | Guo R, Hao W, Gong D (2012) Effects of water stress on germination and growth of linseed Seedlings (Linum usitatissimum L), photosynthetic efficiency and accumulation of metabolites. J Agric Sci 4: 253-65. |
| [53] | Lum MS, Hanafi MM, Rafii YM, et al. (2014) Effect of drought stress on growth, proline and antioxidant enzyme activities of upland rice. J Anim Plant Sci 24: 1487-1493. |
| [54] | Hamim, Sopandie D, Jusuf D (1996) Some morphological and physiological characteristics of tolerant and sensitive soybean to drought stress. Hayati 3: 30-34. |
| [55] | Sopandie D, Hamim, Jusuf M, et al. (1996) Drought tolerance of soybean: accumulation 01 proline and absisic acid in relation to leave osmotic potential and osmotic adjustment. Bul Agron 24: 6-9. |
| [56] | Fendiyanto MH, Satrio RD, Suharsono S, et al. (2019) QTL for aluminum tolerance on rice chromosome 3 based on root length characters. Sabrao J Breed Genet 51: 451-469. |
| [57] |
Kadioglu A, Terzi R (2007) A dehydration avoidance mechanism : leaf rolling das einrollen von blä ttern als schutz vor austrocknung zusammenfassung. Bot Rev 73: 290-302. doi: 10.1663/0006-8101(2007)73[290:ADAMLR]2.0.CO;2
|
| [58] | Fayez KA, Bazaid SA (2014) Improving drought and salinity tolerance in barley by application of salicylic acid and potassium nitrate. J Saudi Soc Agric Sci 13: 45-55. |
| [59] |
Valentovič P, Luxová M, Kolarovič L, et al. (2006) Effect of osmotic stress on compatible solutes content, membrane stability and water relations in two maize cultivars. Plant, Soil Environ 52: 186-191. doi: 10.17221/3364-PSE
|
| [60] |
Rosawanti P, Ghulamahdi M, Khumaida N, et al. (2015) Anatomical and physiological responses of soybean root to drought stress. J Agron Indones 43: 186-192. doi: 10.24831/jai.v43i3.11243
|
| [61] |
Fenta B, Beebe S, Kunert K, et al. (2014) Field Phenotyping of Soybean Roots for Drought Stress Tolerance. Agronomy 4: 418-435. doi: 10.3390/agronomy4030418
|
| [62] |
Munawaroh L, Sulistyono E, Lubis I (2016) Morphological and physiological characters related to water use efficiency of upland rice varieties. J Agron Indones (Indonesian J Agron) 44: 1-7. doi: 10.24831/jai.v44i1.12470
|
| [63] |
Sujinah S, Hairmansis A, Sasmita P, et al (2020) Relationship between Rice growth phenology with biomass, maturity, grain yield, and the effect of fertilization. J Penelit Pertan Tanam Pangan 4: 63-71. doi: 10.21082/jpptp.v4n2.2020.p63-71
|
| [64] | Safitri H, Purwoko BS, Dewi IS, et al. (2011) Correlation and path analysis on phenotypic characters of doubled haploid rice lines. Widyariset 14: 295-304. |
| [65] |
Girousse C, Bournoville R, Bonnemain JL (1996) Water deficit-induced changes in concentrations in proline and some other amino acids in the phloem sap of alfalfa. Plant Physiol 111: 109-113. doi: 10.1104/pp.111.1.109
|
| [66] |
Safriyani E, Hasmeda M, Munandar M, et al. (2019) Correlation of growth and product components on integrated farming rice-azolla etty. J Lahan Suboptimal 7: 59-65. doi: 10.33230/JLSO.7.1.2018.344
|
| [67] | Tiwari DN, Tripathi SR, Tripathi MP, et al. (2019) Genetic variability and correlation coefficients of major traits in early maturing rice under rainfed lowland environments of Nepal. Adv Agric 2019: 1-9. |
| [68] | Sreedhar S, Uma Reddy R (2019) Association studies for yield and its traits in rice (Oryza sativa L.) Genotypes. Int J Curr Microbiol Appl Sci 8: 2337-2342. |
| [69] | Seyoum M, Alamerew S BK (2012) Genetic variability, heritability, coefficient and path analysis for yield and yield related traits in upland rice (Oryza sativa L.). J Plant Sci 7: 13-22. |
| [70] |
Moshelion M, Halperin O, Wallach R, et al. (2015) Role of aquaporins in determining transpiration and photosynthesis in water-stressed plants: Crop water-use efficiency, growth and yield. Plant, Cell Environ 38: 1785-1793. doi: 10.1111/pce.12410
|
Figures(3) / Tables(15)

Didi Darmadi, Ahmad Junaedi, Didy Sopandie, Supijatno, Iskandar Lubis, Koki Homma. Water-efficient rice performances under drought stress conditions[J]. AIMS Agriculture and Food, 2021, 6(3): 838-863. doi: 10.3934/agrfood.2021051


 DownLoad: