Review Topical Sections

Seven Tesla MRI in Alzheimer's disease research: State of the art and future directions: A narrative review

  • Received: 27 July 2023 Revised: 29 November 2023 Accepted: 04 December 2023 Published: 11 December 2023
  • Seven tesla magnetic resonance imaging (7T MRI) is known to offer a superior spatial resolution and a signal-to-noise ratio relative to any other non-invasive imaging technique and provides the possibility for neuroimaging researchers to observe disease-related structural changes, which were previously only apparent on post-mortem tissue analyses. Alzheimer's disease is a natural and widely used subject for this technology since the 7T MRI allows for the anticipation of disease progression, the evaluation of secondary prevention measures thought to modify the disease trajectory, and the identification of surrogate markers for treatment outcome. In this editorial, we discuss the various neuroimaging biomarkers for Alzheimer's disease that have been studied using 7T MRI, which include morphological alterations, molecular characterization of cerebral T2*-weighted hypointensities, the evaluation of cerebral microbleeds and microinfarcts, biochemical changes studied with MR spectroscopy, as well as some other approaches. Finally, we discuss the limitations of the 7T MRI regarding imaging Alzheimer's disease and we provide our outlook for the future.

    Citation: Arosh S. Perera Molligoda Arachchige, Anton Kristoffer Garner. Seven Tesla MRI in Alzheimer's disease research: State of the art and future directions: A narrative review[J]. AIMS Neuroscience, 2023, 10(4): 401-422. doi: 10.3934/Neuroscience.2023030

    Related Papers:

    [1] Voke O. Urhibo, Bernard O. Ejechi . Crude oil degradation potential of bacteria isolated from oil-polluted soil and animal wastes in soil amended with animal wastes. AIMS Environmental Science, 2017, 4(2): 277-286. doi: 10.3934/environsci.2017.2.277
    [2] Joan Nyika, Megersa Olumana Dinka . A mini-review on wastewater treatment through bioremediation towards enhanced field applications of the technology. AIMS Environmental Science, 2022, 9(4): 403-431. doi: 10.3934/environsci.2022025
    [3] Nguyen Trinh Trong, Ba Le Huy, Nam Thai Van . Kinetic, isotherm, and thermodynamic studies on diesel oil adsorption by biodegradable cellulose aerogel from rambutan peel waste. AIMS Environmental Science, 2025, 12(3): 373-399. doi: 10.3934/environsci.2025017
    [4] Tuan Syaripah Najihah, Mohd Hafiz Ibrahim, Nurul Amalina Mohd Zain, Rosimah Nulit, Puteri Edaroyati Megat Wahab . Activity of the oil palm seedlings exposed to a different rate of potassium fertilizer under water stress condition. AIMS Environmental Science, 2020, 7(1): 46-68. doi: 10.3934/environsci.2020004
    [5] Volodymyr Ivanov, Viktor Stabnikov . Calcite/aragonite-biocoated artificial coral reefs for marine parks. AIMS Environmental Science, 2017, 4(4): 586-595. doi: 10.3934/environsci.2017.4.586
    [6] Navid Ahmadi, Mozhgan Ahmadi Nadoushan, Mohammad Hadi Abolhasani, Abbas Hosseini . Investigating the efficiency of biological treatment process of oil pollutants using mix of Scenedesmus obliquus and Chlamydomonas reinhardtii algae: A case study. AIMS Environmental Science, 2021, 8(3): 221-237. doi: 10.3934/environsci.2021015
    [7] Robert Russell Monteith Paterson . Depletion of Indonesian oil palm plantations implied from modeling oil palm mortality and Ganoderma boninense rot under future climate. AIMS Environmental Science, 2020, 7(5): 366-379. doi: 10.3934/environsci.2020024
    [8] Anugrah Ricky Wijaya, Alif Alfarisyi Syah, Dhea Chelsea Hana, Helwani Fuadi Sujoko Putra . Addition of chitosan to calcium-alginate membranes for seawater NaCl adsorption. AIMS Environmental Science, 2024, 11(1): 75-89. doi: 10.3934/environsci.2024005
    [9] Guillermo Samperio-Ramos, J. Magdalena Santana-Casiano, Melchor González-Dávila, Sonia Ferreira, Manuel A. Coimbra . Variability in the organic ligands released by Emiliania huxleyi under simulated ocean acidification conditions. AIMS Environmental Science, 2017, 4(6): 788-808. doi: 10.3934/environsci.2017.6.788
    [10] Abubakar Aji, Mysara Eissa Mohyaldinn, Hisham Ben Mahmud . The role of polymer nanocomposites in sustainable wax deposition control in crude oil systems - systematic review. AIMS Environmental Science, 2025, 12(1): 16-52. doi: 10.3934/environsci.2025002
  • Seven tesla magnetic resonance imaging (7T MRI) is known to offer a superior spatial resolution and a signal-to-noise ratio relative to any other non-invasive imaging technique and provides the possibility for neuroimaging researchers to observe disease-related structural changes, which were previously only apparent on post-mortem tissue analyses. Alzheimer's disease is a natural and widely used subject for this technology since the 7T MRI allows for the anticipation of disease progression, the evaluation of secondary prevention measures thought to modify the disease trajectory, and the identification of surrogate markers for treatment outcome. In this editorial, we discuss the various neuroimaging biomarkers for Alzheimer's disease that have been studied using 7T MRI, which include morphological alterations, molecular characterization of cerebral T2*-weighted hypointensities, the evaluation of cerebral microbleeds and microinfarcts, biochemical changes studied with MR spectroscopy, as well as some other approaches. Finally, we discuss the limitations of the 7T MRI regarding imaging Alzheimer's disease and we provide our outlook for the future.


    Abbreviations

    Aβ:

    beta-amyloid; 

    AD:

    Alzheimer's disease; 

    ASL:

    Arterial Spin Labelling; 

    BOLD:

    blood oxygenation level-dependent; 

    CA:

    Cornus Ammonis; 

    CA1-SRLM:

    stratum radiatum and lacunosum-moleculare of the Cornu Ammonis' field 1; 

    CBF:

    cerebral blood flow; 

    CEST:

    chemical exchange saturation transfer; 

    CMI:

    cerebral microinfarcts; 

    CNR:

    contrast-to-noise ratio; 

    CSF:

    cerebrospinal fluid; 

    DKI:

    diffusion kurtosis imaging; 

    DTI:

    diffusion tensor imaging; 

    EEG:

    electroencephalography; 

    FLAIR:

    fluid attenuated inversion recovery; 

    fMRI:

    functional MRI; 

    Gln:

    glutamine; 

    Glu:

    glutamate; 

    gluCEST:

    Chemical Exchange Saturation Transfer of glutamate; 

    GABA:

    γ-Aminobutyric acid; 

    GRE:

    gradient recalled echo; 

    LC:

    locus coeruleus; 

    MCI:

    mild cognitive impairment; 

    MI:

    myo-inositol; 

    MT:

    magnetization transfer; 

    MRS:

    MR Spectroscopy; 

    PET:

    Positron Emission Tomography; 

    PVS:

    perivascular spaces; 

    PiB:

    Pittsburgh compound B; 

    RF:

    radiofrequency; 

    SNR:

    signal-to-noise ratio; 

    SWI:

    susceptibility-weighted imaging; 

    TSE:

    turbo spin echo; 

    UHF:

    ultra-high field

    1. Introduction

    Accidental marine oil spills (e.g., Exxon Valdez, Alaska, in 1989; BP Deepwater Horizon, Gulf of Mexico, in 2010) can lead to devastating environmental and socio-economic impacts [1,2]. These impacts can last for many years, and call for adequate mitigating response by decision makers. The primary response, which is commonly focused on the physical/mechanical removal of oil from the impacted environment, can be limited, particularly when large spills occur at sea. For instance, extensive mechanical operations from the Deepwater Horizon release have led to only ~3% of oil removal by skimming [3]. The breakdown of an oil slick into smaller droplets in the water column (a process known in the oil literature as “dispersion”) causes dilution of the oil, thus reducing its potential impacts on the shorelines and coastal ecosystems. Dispersion can be enhanced by the addition of chemical dispersants. The mass fraction of oil entrained in the water column as discrete small droplets relative to the total mass of oil is referred to as dispersant effectiveness. Many factors can conceivably influence oil chemical dispersion including the type and quantity of dispersants, salinity and temperature of seawater, wave-mixing energy [4] and oil physicochemical properties, such as viscosity, gravity, interfacial tension with water [5].

    An added benefit of oil chemical dispersion is the acceleration of oil biodegradation. Chemical dispersion can lead to the formation of tiny and stable oil droplets in the water column, thus increasing the surface area between oil and water and, subsequently, oil availability for microbial uptake. Biodegradation of dispersed oil droplets tends to occur preferentially at the oil-water interface since many oil components are poorly soluble in water. Enhanced hydrocarbon biodegradation appears to be correlated with a decrease in the droplet-size [6] and microbial attachment to oil droplets [7,8]. However, there are concerns that chemical dispersion could increase the oil concentration in the water column to toxic levels [9].

    In addition to the potential effects of chemical dispersion on oil dilution and biodegradation, the presence of sufficient concentrations of nutrients (N and P) and/or oxygen could enhance the rate of oil biodegradation by indigenous hydrocarbon-degrading microorganisms [10,11,12,13]. The range of NO3-N needed for maximum oil biodegradation has been estimated to be from ~2 to 10 mg/L [13,14,15]. Generally, the recommended N:P ratio, on a mass basis, is about 10:1 [16,17,18,19].

    Water salinity also plays an important role on oil biodegradation in that it can affect the solubility of many compounds including dispersants and oil components, and the action of microorganisms on hydrocarbons. Research on the influence of salinity on petroleum accommodation by dispersants reported an increase in the effectiveness of two dispersants, Corexits 9527 and 9500, with increasing salinity in the range of 0 to 35 ppt [20]. A study reported that the action of microorganisms on the different fractions of Ashtart crude oil was dependent on salinity concentration [21]. The two worst spills in U.S. history (1) the Exxon Valdez occurred near island shorelines with low water salinity, and (2) the BP Deepwater Horizon occurred in deep sea with higher salinity. Thus, research to increase our understanding on oil biodegradation at different salinity conditions, resembling the salinity of coastal and far offshore waters, is critical for informed remediation and response strategies to limit the impacts of oil spills.

    Recently, we reported our findings on oil biodegradation in brackish water [22]. This paper reports the results of lab-scale experiments on aerobic biodegradation of Endicott oil (Endicott Island, Alaska, USA) in seawater. The objectives were three: (1) Compare the effectiveness of physical and chemical dispersion on the rate of oil biodegradation in seawater, (2) Evaluate the influence of nutrient availability on the rate of biodegradation of physically and chemically dispersed oil, and (3) Determine whether the use of chemical dispersants combined with exogenous nutrients enhances oil biodegradation in seawater.


    2. Materials and Methods

    Seawater samples (salinity: 29.1‰) were collected from Prince William Sound (PWS), Alaska (60.79109°N, 146.90607°W). The samples were filtered using a 10 μm Whatman paper, filtering flask and Buchner funnel (Figure S1 of the supplementary information-SI). A volume of 20 ml of weathered on Endicott oil was placed in 4 L bottle (i.e., oil to water ratio is 1/200 on a volume basis). The oil was obtained from Ohmsett (The National Oil Spill Response Research & Renewable Energy Test Facility), New Jersey, USA, and referred as weathered oil based on its history. The oil was then either physically or chemically dispersed (Corexit 9500, dispersant-to-oil ratio, 1:10 v/v) by mixing for 16 hours over a magnetic stirrer and allowing the suspension to settle for 30 minutes (Figure S2 of SI). For the chemical dispersion, the stirring speed was adjusted to create a small vortex ( ~1/4 of water depth), and the dispersant was applied gently to the oil slick with a syringe. Then, the mixing speed was adjusted to draw a vortex in the water column all the way to the bottom of the aspirator bottle. Packs of ice were placed around the bottle to keep the mixtures at low temperature and limit potential oil biodegradation during the 16 hour mixing time. The physically dispersed oil is referred herein as water accommodated fraction (WAF) and the chemically dispersed oil as chemically enhanced water accommodated fraction (CEWAF). After the settling time, 100 mL were collected from a spigot in the bottom of the bottle and were discarded. This resulted in the removal of undispersed oil from the spout at the bottom of the bottle. Then, a volume of 100 mL WAF or CEWAF was transferred to each microcosm.

    The oil biodegradation was evaluated under low nutrient (LN) and high nutrient (HN) (Table S1 of the SI) for both WAF and CEWAF in triplicate sealed microcosms (Figure S3 of the SI). The LN included only background nutrient in seawater (0.013 ± 0.001 mg NO3-N/L; 0.200 ± 0.022 mg PO4-P/L) while the HN was supplemented with nutrient (background nutrient in seawater + 100 mg NO3-N/L and 10 mg PO4-P/L). Prior to the experiments, all microcosms were tested for potential gas leak by filling them with O2 and submerging them under water for 5 minutes. None of the microcosms used in the experiment showed any leak. The microcosms were constructed using modified 250-mL wide-mouth, screw-cap Erlenmeyer flasks [23], and included (a) a CO2 trap filled with a trapping solution (sodium hydroxide: NaOH), (b) a sample port in the cap of the trap tubes for removing or replacing the trapping solution periodically, and (c) a sidearm for controlled introduction of oxygen by attaching an oxygen-filled ground-glass syringe to the sidearm and allowing the pressure on the syringe barrel to equalize with the headspace gas pressure inside the microcosm. The microcosms were continuously agitated at 140 rpm by a shaker system and incubated at constant temperature (15 ± 0.5 °C) for 42 days (Figure S4 of the SI). The background seawater nutrient concentrations (Table S1 of the SI) were measured using test kits (HACH 2668000, 2429800, 2672245, 2106069, and 2742645) and a spectrophotometer (Thermo Scientific Evolution 201 UV-Visible). Key parameters (oil removal, O2 consumption, CO2 production, biomass production and nutrient consumption) of aerobic Endicott oil biodegradation were determined for both WAF and CEWAF microcosms. In addition to th e active microcosms, the experiments included control microcosms that were poisoned with sodium azide (0.5% w/v) to prevent microbial growth and oil biodegradation.

    Temporal changes in the concentration of total petroleum hydrocarbon (TPH) and oil components including alkanes, polycyclic aromatic hydrocarbons (PAHs) and alkylated PAHs were determined by gravimetric methods and gas chromatography/mass spectrometry (GC/MS), respectively. The most probable number (MPN) method was used to estimate biomass production. These measurements were performed at days 0 (i.e., after the mixing of oil with water), 14, 28 and 42 from three independent active microcosms. In the control microcosms, TPH concentration and biomass were measured at days 0 and 42. For TPH measurement, the weight of oil was measured after extraction with dichloromethane (DCM) as per EPA Method 3510C [24]. The extraction procedures are based on the separation of the oil content from the oil-water mixtures with DCM in a separatory funnel. The separated DCM-oil phase was collected in a clean pre-weighted glass beaker. Then the beaker was kept in the laboratory hood until complete DCM evaporation, and the weight was measured. The extracted oil was further analyzed for alkanes, PAH and alkylated PAH by GC/MS following the protocol reported in our recent paper [22]. The oil component values were normalized to hopane (17a (H), 21b (H)-hopane), a conservative biomarker that is very resistant to biodegradation. Analysis of variance (ANOVA) coupled with Tukey’s test at 95% confidence intervals (α=0.05) was performed on the oil data to determine whether the measured temporal changes were significant. The MPN assay was conducted using 96-well tests and selective growth substrates (Table S3 of the SI) to estimate biomass production of alkane degraders, PAH degraders, and heterotrophic bacteria [25]. The amount of O2 introduced in the microcosms was recorded, and CO2 produced was trapped into a solution of NaOH (Figure S3 of the SI). The CO2-trapping solution was periodically removed and titrated using sulfuric acid to the phenolphthalein endpoint (pH=8.3) to determine CO2 production. Theoretical N and P consumption was calculated (see Equations used in the SI) based on biomass formula (C5H7O2NP0.1) [26].

    A summary of this section is presented in Table 1 including sample collection and filtration, physical and chemical oil dispersion in seawater, determination of oil concentration, O2 consumption, CO2 production, biomass estimation and nutrient consumption estimation. The methods described here are further detailed in a recent article [22].

    Table 1. Summary of materials and methods.
    MethodsDescription
    Seawater collection/ Preservation Collected at Prince William Sound/Alaska (Salinity: 29.1‰) using Certified-clean amber glass bottles, kept at ~4 °C
    Sample filtrationVacuum filtration (10 μm Whatman paper filter)
    Dispersed oil Chemically (Corexit 9500) enhanced water accommodated fraction (CEWAF)
    Physically water accommodated fraction (WAF)
    Oil-to-water ratio (OWR) = 1:200 (v/v)
    Dispersant-to-oil ratio (DOR) = 1:10 (v/v)
    Nutrient Low (LN): CEWAF or WAF only (0.013 ± 0.001 mg NO3-N/L;
    0.200 ± 0.022 mg PO4-P/L)
    High (HN): CEWAF or WAF +100 mg NO3-N/L and 10 mg PO4-P/L
    Active/control microcosmsActive: No addition of bactericide
    Control: Addition of bactericide (0.5% w/v of sodium azide)
    Oil measurements Total Petroleum Hydrocarbon (TPH): Gravimetric methods
    Oil components (Normal and Methyl Alkanes, PAHs, Alkylated PAHs): GC/MS
    Statistical significance in oil data: ANOVA coupled with Tukey’s test
    Biomass estimationMost probable number (MPN): alkanes, PAHs, and heterotrophic bacteria
    O2 ConsumptionMeasured of volume
    CO2 productionTitration of CO2 trapping solution
    Nutrient consumptionTheoretical calculations of nitrogen and phosphorus consumption based on biomass formula (C5H7O2NP0.1) [26]
     | Show Table
    DownLoad: CSV

    3. Results


    3.1. Oil biodegradation as a function of time

    The physically dispersed oil (WAF) microcosms showed comparable initial (day 0) total petroleum hydrocarbon (TPH) concentrations at 0.018 g/L ± 0.001 for the low nutrient (LN) and 0.021 g/L ± 0.001 for the high nutrient (HN) treatments The chemically dispersed oil (CEWAF) also showed comparable initial TPH: 0.347 g/L ± 0.033 for the LN and 0.379 g/L ± 0.042 for the HN, approximately an order of magnitude larger than the WAF. Figure 1A shows the temporal changes in TPH for both WAF and CEWAF microcosms during the 42 days of the experiments. The changes were negligible in the WAF for both treatments, providing no evidence of oil biodegradation. At day 42, the TPH concentration in the control WAF remained comparable with the TPH in the active microcosms (Figure 1A). However, in the CEWAF microcosms, the TPH removal reached 26% and 44% in LN and HN treatments, respectively. Statistical analyses (ANOVA and Tukey tests) revealed no difference in oil concentration in the LN between 0 and 14 days. However, the difference became significant at day 28. After day 28, no significant changes were observed. In the HN, the statistical analyses showed evidence of a significant oil biodegradation from day 0 to day 14. A summary of the statistical data results is reported in Table S2 of the SI. As expected, the control CEWAF microcosms showed no evidence of oil biodegradation with time as indicated by the measured TPH at day 42 (Figure 1A). Figure 1B and 1C showed the temporal changes in oil components (alkanes, alkylated PAHs and PAHs from GC/MS analyses) for LN and HN in the CEWAF microcosms, respectively. The GC/MS analyses revealed that alkanes and alkylated PAHs accounted for at least 97% of the compounds in both LN and HN at day 0: Alkanes ( ~71%), alkylated PAHs ( ~26%) and PAHs (only ~3%). The results showed (a) statistically significant changes in alkane biodegradation in the HN from day 0 to day 14 while remaining insignificant in the LN from day 0 to 42, (b) no significant changes in alkylated PAH from day 0 to day 42 for both LN and HN, and (c) significant changes in PAH biodegradation from day 0 to day 14 for both LN and HN.

    Figure 1. Temporal changes in oil concentrations. (A) Total petroleum hydrocarbon (TPH) for both low nutrient (LN) and high nutrient (HN). Hollow symbols represent TPH concentration in WAF microcosms (i.e., no addition of dispersant). Filled symbols are for CEWAF microcosms (i.e., addition of the dispersant Corexit 9500). Error bars represent one standard deviation based on independent triplicates. TPH concentrations at the end of the experiments in the control microcosms are shown for WAF (hollow square) and CEWAF (filled square). (B) Oil components (alkanes, alkylated PAHs and PAHs) for LN (CEWAF) from GC/MS analyses. C) Oil components for HN (CEWAF).

    Our results demonstrate that (1) chemical dispersion with Corexit 9500 has considerably increased dispersed Endicott oil in seawater, (2) nutrient supplementation to seawater significantly increased the rate of chemically dispersed oil biodegradation by a factor of ~2 compared with its biodegradation solely in background seawater, and (3) the oil biodegradation concerned mainly alkane compounds.


    3.2. Oxygen consumption and carbon dioxide production

    Figure 2 shows the cumulative amount of O2 consumed and CO2 produced for both WAF and CEWAF during the 42 days of the experiments. In the WAF microcosms, O2 consumption remained relatively low and comparable in the LN (2.18 < O2 < 5.56 mg) to the HN (3.37 < O2 < 6.25). In the CEWAF microcosms, O2 consumption was substantially lower in the LN (1.19 < O2 < 5.26 mg) than in the HN (6.65 < O2 < 14.19 mg). Overall, the cumulative O2 consumption was at least two times higher in the HN of the CEWAF than the other observed values.

    Figure 2. Oxygen (O2) consumption (left panel) and carbon dioxide (CO2) production (right panel) as a function of time for both low nutrients (LN) and high nutrients (HN). Hollow symbols represent measured values in the physically dispersed oil (WAF) microcosms (i.e., no addition of dispersants) while filled symbols are for chemically dispersed oil (CEWAF) microcosms (i.e., addition of a dispersant: Corexit 9500). Error bars represent one standard deviation based on triplicates.

    Carbon dioxide production remained relatively low and comparable in the WAF microcosms: 0.82 < CO2-C < 1.17 mg in the LN and 0.90 < CO2-C < 1.16 mg in the HN. In the CEWAF microcosms, CO2 production was substantially lower in the LN (1.06 < CO2-C < 1.67 mg) than in the HN (3.62 < CO2-C < 4.15 mg). Overall, the cumulative CO2 production was at least two times higher in the HN of the CEWAF than the other observed values.


    3.3. Biomass production

    The population of alkane degraders (AD) and heterotrophic bacteria (HB) varied temporally in both WAF and CEWAF microcosms (Figure 3). The microbial population increased during the first 14 days, but decreased thereafter. In the WAF, the AD population (Figure 3A) increased from ~1 × 100 count/mL at day 0 to 1.03 × 10³ count/mL in the LN and 3.62 × 10² count/mL in the HN at day 14. Then, it decreased to ~0 count/mL at day 28 and remained the same at day 42 for both LN and HN treatments. In the CEWAF, the AD population (Figure 3A) increased from ~5.8 × 101 count/mL at day 0 to 1.03 × 10³ count/mL in the LN and 7.2 × 10⁴ count/mL in the HN at day 14. Then, the AD population decreased to ~0 count/mL in the LN at day 28 and remained the same at day 42. In the HN, it slightly decreased to 4.0 × 10⁴ count/mL at day 28 and by an order of magnitude (1.4 × 10³) count/mL at day 42.

    Figure 3. Variation in microbial population as a function of time for both low nutrient (LN) and high nutrients (HN): (A) Alkane degraders and (B) Heterotrophic bacteria. Hollow symbols represent microbial population in physically dispersed oil (WAF) microcosms (i.e., no addition of dispersants) while filled symbols are for chemically dispersed oil (CEWAF) microcosms (i.e., addition of a dispersant: Corexit 9500). Error bars represent one standard deviation based on triplicates.

    In the WAF microcosms, the HB population (Figure 3B) increased from ~1.0 × 10³ count/mL at day 0 to 1.0 × 10⁴ count/mL in the LN and 5.8 × 10³ count/mL in the HN at day 14. Then, it decreased in both LN and HN by at least an order of magnitude at day 42. In the CEWAF microcosms, the HB population (Figure 3B) increased from ~2.8 × 10⁴ count/mL at day 0 to 4.6 × 10⁵ count/mL in the LN and 2.9 × 10⁶ count/mL in the HN at day 14. Then, it decreased in both LN and HN to approximately an order of magnitude at day 42. Unexpectedly, no PAH degraders (PAHD) were observed using the MPN assay. As expected, no microbial population (AD, PAHD and HB) was observed in the control microcosms.

    Based on the AD and HB population and assuming a cell dry weight of 2.8 × 10⁻¹⁰ mg [26], the net yield of biomass was calculated for the CEWAF microcosms and reported in Table 2. The net yield of biomass was lower in the LN (1.375 × 10⁻³ mg biomass/mg oil) than in the HN (4.923 × 10⁻³ mg biomass/mg oil).

    Table 2. Net yield of biomass (YX) for alkane-degraders, PAH degraders and heterotrophic bacteria in low nutrient (LN) and high nutrient (HN) of the chemically dispersed oil (CEWAF) microcosms.
    S (mg oil/L)X (mg biomass/L)YX (mg biomass/mg oil)
    LNHNLNHNLNHN
    Alkane degraders0.0000.0203.339 × 10-61.210 × 10⁻⁴
    PAH degraders0.0000.000--
    Heterotrophic bacteria91.667165.3330.1250.7941.364 × 10-34.802 × 10⁻³
    Total biomass 0.1260.8141.375 × 10-34.933 × 10⁻³
    S—substrate (Endicott Oil); X—biomass (alkane degraders, PAH degraders and heterotrophic bacteria); YX—net yield (mg of biomass per mg of oil). No substrate observed to be degraded in samples without dispersant; therefore, no yield of biomass was calculated.
     | Show Table
    DownLoad: CSV

    Overall, the results indicated that the microbial population (1) increased during the first 14 days of the experiment and decreased thereafter, (2) was more important in the CEWAF than in the WAF microcosms, and (3) was lower in the LN than in the HN for the CEWAF microcosms. No microbial population (AD, PAHD, and HB) was observed in the control microcosms.


    3.4. Nutrient consumption

    Table 3 shows the estimated N and P consumption based on biomass growth as per the equations described in the SI. The increase in biomass ( < 0.003 mg/L) and N and P consumption (0.000 mg/L) remained negligible in the WAF microcosms. In the CEWAF microcosms, the LN showed a substantially lower increase in biomass (0.126 mg/L) production, nitrogen (0.015 mg/L) and phosphorus (0.003 mg/L) consumption than the HN (biomass: 0.814 mg/L, nitrogen: 0.098 mg/L and phosphorus consumption: 0.022 mg/L).

    Table 3. Estimated phosphorus and nitrogen consumption due to biomass growth for both low nutrient (LN) and high nutrient (HN) treatments of the physically dispersed oil (WAF) and chemically dispersed oil (CEWAF) microcosms.
    Biomass Increased (mg/L)Estimated Nitrogen Consumption (mg/L)Estimated Phosphorus Consumption (mg/L)
    WAF-LN0.0030.0000.000
    WAF-HN0.0010.0000.000
    CEWAF-LN0.1260.0150.003
    CEWAF-HN0.8140.0980.022
     | Show Table
    DownLoad: CSV

    3.5. Comparison of oil biodegradation and O2 consumption

    Temporal changes in oil removal (%) and O2 consumption (mg/L) in both LN and HN treatments of the CEWAF are compared in Figure 4. In the LN treatment, O2 consumption slowly increased from 11.09 mg/L at day 2 to 28.77 mg/L at day 14, which corresponded to only 11.90% of oil removal (Figure 4A). After day 14, O2 consumption continued to increase to a cumulative value of 52.58 mg/L at day 42. As a result, oil removal reached 26% at day 42. In the HN treatment, a rapid increase in O2 consumption (from 66.47 mg/L at day 2 to a cumulative value of 109.13 mg/L at day 14) coincided with an important oil removal (41% at day 14) (Figure 4B). After day 14, changes in O2 consumption varied only from 109.13 mg/L to a cumulative value of 141.86 mg/L at day 42. Similarly, the oil removal only slightly changed after day 14 to a cumulative value of 44% at day 42.

    Figure 4. Comparison of total petroleum hydrocarbon (TPH) removal with oxygen consumption as a function of time for both low nutrients (LN) (Panel A) and high nutrients (HN) (Panel B) of the chemically dispersed oil (CEWAF) microcosms (i.e., addition of a dispersant: Corexit 9500).

    4. Discussion

    This experiment demonstrated that the application of a chemical dispersant (Corexit 9500) and nutrient supplementation (nitrogen and phosphorus) led to substantial aerobic biodegradation of Endicott oil in seawater. The concentration of dispersed oil in seawater as result of physical processes (WAF) was an order of magnitude lower than that from the chemical dispersion (CEWAF) despite the same mixing conditions. Thus, the chemical dispersion increased the bioavailability of oil and its subsequent biodegradation as depicted by a removal of up to 44% of total petroleum hydrocarbon (TPH) (Cf. Figure 1A). In the WAF, TPH removal remained negligible during the entire experiment, which could probably be attributed to the formation of unstable oil droplets that coalesce rapidly; thereby decreasing the surface area between the oil and water, and the availability of oil droplets for microbial uptake. Our results are consistent with the findings of our recent research on oil biodegradation in brackish water [22] as well as previous studies that reported the effectiveness of Corexit 9500 in dispersing oil in seawater [27] and enhancing oil biodegradation rates [6]. They also agree with previous findings from research on the Exxon Valdez spill showing that the effectiveness of oil biodegradation was largely determined by the availability of a sufficient concentration of oil and nutrients [11]. In addition to the effects of chemical dispersion on oil bioavailability, nutrient supplementation significantly accelerated the rate of oil biodegradation as confirmed by ANOVA coupled with Tukey’s test at 95% confidence intervals (α=0.05). The increase of microbial metabolic activity with availability of nutrients also appeared to be consistent with the rate of oil biodegradation as indicated by the amounts of O2 consumed (109.13 mg/L) and oil removal (41%) during the first 14 days of the experiment (Cf. Figure 4B). When nutrients were not supplemented, only 28.77 mg/L of O2 consumption and 11.90% of oil removal were observed during the same time period (Cf. Figure 4A). A higher production of CO2 (Cf. Figure 2) and biomass (Cf. Figure 3) in the microcosms supplemented with nutrients also provided evidence for the effects of nutrient availability on accelerating the biodegradation rate of chemically dispersed oil. The MPN method most likely underestimated the biomass growth as sometimes only ~10% of indigenous bacteria in marine system would develop in culture [28]. Unexpectedly, no PAH degraders were observed. The fact that alkylated PAHs biodegradation was not observed and that the PAHs compounds formed only about 2.5% of the components could explain in part the non-detection of PAH degraders using the MNP methods. Another explanation could be associated with the limitations of the MPN method itself. An inhibition of PAH degrader growth by high salinity (29‰) was also possible. In similar experiments that we performed at low salinity (6.5‰) conditions, PAH degraders were observed at ~105 cells/mL [22]. A previous study also showed that an increase in salinity can cause an inhibition of PAH degradation activity [29]. These authors observed a suppression of the activity of Sphingomonas paucinobilis BA 2 (anthracene degraders) and strain BP 9 (pyrene degraders) as well as autochthonous soil bacteria, which they attributed to an increase in pore-water salinity in the soil to the range of marine environments.

    After day 14, the biodegradation rate remained relatively steady in the LN until day 28 while it became very slow in the HN. In the LN, the slower biodegradation rate was presumably due to the lack of nutrients to stimulate maximum microbial activity. The estimated N and P consumption due to biomass growth was much lower in the LN than the HN (Cf. Table 3). The net yield of biomass per mass oil removal was ~4 times lower in the LN than the HN (Cf. Table 2). As a result, it took a longer time for the bacteria to remove the most easily degradable hydrocarbon compounds in the LN. In the HN, the most easily degradable alkane compounds have been presumably depleted within 14 days due to the abundance of nutrients favorable to maximum microbial activity as O2 was not a limiting factor. This is consistent with the statistical analyses providing evidence of significant alkane biodegradation within the first 14 days of the experiments while no significant changes were observed after day 14. Once these compounds were removed, it appeared that the biodegradation rate became no longer dependent on the availability of nutrients. The decrease in the biodegradation rate after day 28 in the LN and day 14 in the HN could have resulted from an increase in the mass fraction of recalcitrant compounds i.e., barely biodegradable compounds such as high-molecular-weight alkylated PAHs, resins and asphaltenes [30]. Consistently, there was no statistical evidence of alkylated PAHs biodegradation during the experiment. In addition, during the aerobic biodegradation processes, some hydrocarbons that have not fully mineralized could form recalcitrant oxy-hydrocarbons as reported in a recent study on oil weathering after the Deepwater Horizon disaster [31]. Our findings are concordant with previous studies showing an increase in oil biodegradation rate with adequate nutrient supplementation [13,32] and a decrease in the rate concomitant with the disappearance of low-molecular-weight hydrocarbons [13,30,33] even if nutrient supplementation was maintained [34].

    Our findings have also some limitations. Although gas chromatographic-mass spectrometric (GC-MS) approaches are commonly used for the analyses of oil components [35,36,37], it has been recently recognized that many oil compounds are not chromatographically separated or amenable to GC-MS due to volatility. Thus, our findings on oil biodegraded components do not account for polar compounds that can’t be analyzed by conventional techniques. The controlled conditions in the microcosms are also different from those expected in real oil spill scenarios. For instance, dispersed oil and applied nutrients at sea would likely spread and dilute in a large volume of water, thus affecting the overall biodegradation processes. Nonetheless, our microcosm tests indicate that dispersants combined with nutrient supplementation can potentially accelerate oil biodegradation. Although dispersants have been widely used on a large scale to mitigate oil spill like after the Deepwater Horizon wellhead failure in 2010 [2] and field studies have shown the effectiveness of nutrient supplementation in enhancing oil biodegradation [13], we recognize that our findings herein need to be verified on large scale or real oil spill scenarios.


    5. Conclusions

    The dual effects of chemical dispersion by Corexit 9500 and nutrient supplementation have led to a substantial enhancement of aerobic biodegradation of Endicott oil in seawater. The chemical dispersion (CEWAF) has resulted in a dispersed oil concentration that was an order of magnitude higher than that from the physical dispersion (WAF) under similar mixing conditions. Oil biodegradation remained negligible in the WAF while it was considerable in the CEWAF (up to 44% of TPH removal). Nutrient supplementation (N and P) has increased oil biodegradation by a factor of ~2 in comparison to its biodegradation with the background seawater nutrient conditions (i.e., no nutrients supplemented). The observed values of key biodegradation parameters including O2 consumption, CO2 production, biomass increase and estimation of nutrient consumption support our findings regarding the effect of nutrient supplementation on the biodegradation of chemically dispersed Endicott oil in seawater. The findings of this research suggest that the application of chemical dispersants in a high nutrient environment could help mitigate the impacts of oil spills at sea.


    Acknowledgements

    The Prince William Sound/ Regional Citizens’ Advisory Council partially funded the research described here under grant to New Jersey Institute of Technology. The experimental data will be made available upon request and placed in ResearchGate.


    Conflict of Interest

    Researchers working for oil companies, which might have a policy difference with respect to the use of dispersants.


    Conflicts of interest


    The authors have no conflicts of interest to declare.

    [1] Masters CL, Bateman R, Blennow K, et al. (2015) Alzheimer's disease. Nat Rev Dis Primers 1. https://doi.org/10.1038/nrdp.2015.56
    [2] Prince M, Bryce R, Albanese E, et al. (2013) The global prevalence of dementia: a systematic review and meta-analysis. Alzheimers Dement 9: 63-75.e2. https://doi.org/10.1016/j.jalz.2012.11.007
    [3] 
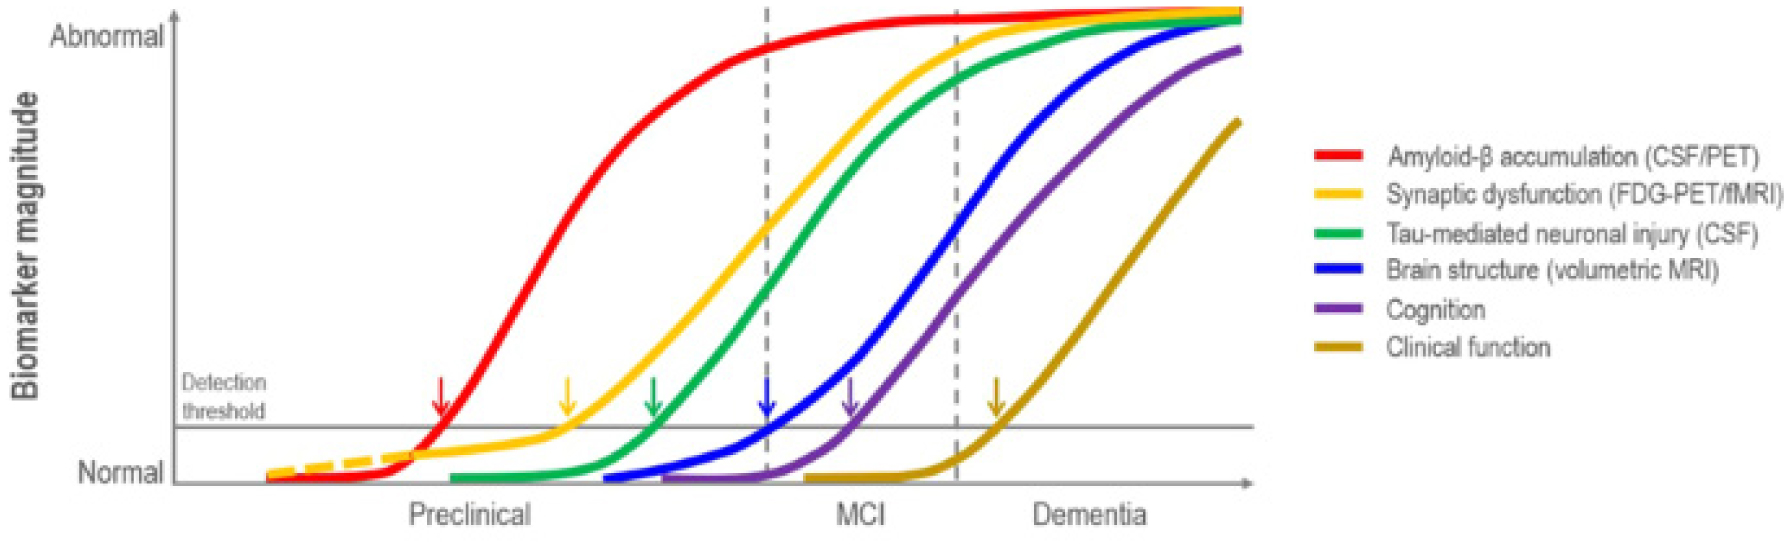
Jack CR, Knopman DS, Jagust WJ, et al. (2010) Hypothetical model of dynamic biomarkers of the Alzheimer's pathological cascade. Lancet Neurol 9: 119-128. https://doi.org/10.1016/S1474-4422(09)70299-6
    [4] Lee BC, Mintun M, Buckner RL, et al. (2003) Imaging of Alzheimer's disease. J Neuroimaging 13: 199-214. https://doi.org/10.1111/j.1552-6569.2003.tb00179.x
    [5] McKhann GM, Knopman DS, Chertkow H, et al. (2011) The diagnosis of dementia due to Alzheimer's disease: recommendations from the National Institute on Aging-Alzheimer's Association workgroups on diagnostic guidelines for Alzheimer's disease. Alzheimers Dement 7: 263-269. https://doi.org/10.1016/j.jalz.2011.03.005
    [6] Knopman DS, Amieva H, Petersen RC, et al. (2021) Alzheimer disease. Nat Rev Dis Primers 7: 33. https://doi.org/10.1038/s41572-021-00269-y
    [7] Arachchige ASPM (2022) 7-Tesla PET/MRI: A promising tool for multimodal brain imaging?. AIMS Neurosci 9: 516-518. https://doi.org/10.3934/Neuroscience.2022029
    [8] Okada T, Fujimoto K, Fushimi Y, et al. (2022) Neuroimaging at 7 Tesla: a pictorial narrative review. Quant Imag Med Surg 12: 3406-3435. https://doi.org/10.21037/qims-21-969
    [9] Zwanenburg JJ, van der Kolk AG, Luijten PR (2013) Ultra-High-Field MR Imaging: Research Tool or Clinical Need?. PET Clin 8: 311-328. https://doi.org/10.1016/j.cpet.2013.03.004
    [10] Apostolova LG, Zarow C, Biado K (2015) Relationship between hippocampal atrophy and neuropathology markers: a 7T MRI validation study of the EADC-ADNI Harmonized Hippocampal Segmentation Protocol. Alzheimers Dement 11: 139-150. https://doi.org/10.1016/j.jalz.2015.01.00
    [11] Düzel E, Costagli M, Donatelli G, et al. (2021) Studying Alzheimer disease, Parkinson disease, and amyotrophic lateral sclerosis with 7-T magnetic resonance. Eur Radiol Exp 5. https://doi.org/10.1186/s41747-021-00221-5
    [12] Theysohn JM, Kraff O, Maderwald S, et al. (2009) The human hippocampus at 7 T--in vivo MRI. Hippocampus 19: 1-7. https://doi.org/10.1002/hipo.20487
    [13] Kerchner GA, Hess CP, Hammond-Rosenbluth KE, et al. (2010) Hippocampal CA1 apical neuropil atrophy in mild Alzheimer disease visualized with 7-T MRI. Neurology 75: 1381-1387. https://doi.org/10.1212/WNL.0b013e3181f736a1
    [14] Barazany D, Assaf Y (2012) Visualization of cortical lamination patterns with magnetic resonance imaging. Cereb Cortex 22: 2016-2023. https://doi.org/10.1093/cercor/bhr277
    [15] Deng M, Yu R, Wang L, et al. (2016) Learning-based 3T brain MRI segmentation with guidance from 7T MRI labeling. Med Phys 43. https://doi.org/10.1118/1.4967487
    [16] Cheng PW, Chiueh TD, Chen JH (2021) A high temporal/spatial resolution neuro-architecture study of rodent brain by wideband echo planar imaging. Sci Rep 11. https://doi.org/10.1038/s41598-021-98132-3
    [17] Yoo PE, John SE, Farquharson S, et al. (2018) 7T-fMRI: Faster temporal resolution yields optimal BOLD sensitivity for functional network imaging specifically at high spatial resolution. NeuroImage 164: 214-229. https://doi.org/10.1016/j.neuroimage.2017.03.002
    [18] Das N, Ren J, Spence J, et al. (2021) Phosphate Brain Energy Metabolism and Cognition in Alzheimer's Disease: A Spectroscopy Study Using Whole-Brain Volume-Coil 31Phosphorus Magnetic Resonance Spectroscopy at 7Tesla. Front Neurosci 15. https://doi.org/10.3389/fnins.2021.641739
    [19] Dusek P, Dezortova M, Wuerfel J (2013) Imaging of Iron. Int Rev Neurobiol 110: 195-239. https://doi.org/10.1016/b978-0-12-410502-7.00010-7
    [20] Kim S, Lee Y, Jeon CY, et al. (2020) Quantitative magnetic susceptibility assessed by 7T magnetic resonance imaging in Alzheimer's disease caused by streptozotocin administration. Quant Imag Med Surg 10: 789-797. https://doi.org/10.21037/qims.2020.02.08
    [21] Pohmann R, Speck O, Scheffler K (2016) Signal-to-noise ratio and MR tissue parameters in human brain imaging at 3, 7, and 9.4 tesla using current receive coil arrays. Magn Reson Med 75: 801-809. https://doi.org/10.1002/mrm.25677
    [22] Uludağ K, Müller-Bierl B, Uğurbil K (2009) An integrative model for neuronal activity-induced signal changes for gradient and spin echo functional imaging. Neuroimage 48: 150-165. https://doi.org/10.1016/j.neuroimage.2009.05.051
    [23] Hazra A, Gu F, Aulakh A, et al. (2013) Inhibitory neuron and hippocampal circuit dysfunction in an aged mouse model of Alzheimer's disease. PloS One 8: e64318. https://doi.org/10.1371/journal.pone.0064318
    [24] Chen C, Ma X, Wei J, et al. (2022) Early impairment of cortical circuit plasticity and connectivity in the 5XFAD Alzheimer's disease mouse model. Transl Psychiat 12. https://doi.org/10.1038/s41398-022-02132-4
    [25] Yang J, Huber L, Yu Y, et al. (2021) Linking cortical circuit models to human cognition with laminar fMRI. Neurosci Biobehav R 128: 467-478. https://doi.org/10.1016/j.neubiorev.2021.07.005
    [26] Korte N, Nortley R, Attwell D (2020) Cerebral blood flow decrease as an early pathological mechanism in Alzheimer's disease. Acta Neuropathol 140: 793-810. https://doi.org/10.1007/s00401-020-02215-w
    [27] Kashyap S, Ivanov D, Havlicek M, et al. (2021) Sub-millimetre resolution laminar fMRI using Arterial Spin Labelling in humans at 7 T. PloS One 16: e0250504. https://doi.org/10.1371/journal.pone.0250504
    [28] Shao X, Guo F, Shou Q, et al. (2021) Laminar perfusion imaging with zoomed arterial spin labeling at 7 Tesla. NeuroImage 245: 118724. https://doi.org/10.1016/j.neuroimage.2021.118724
    [29] Rutland JW, Delman BN, Gill CM, et al. (2020) Emerging Use of Ultra-High-Field 7T MRI in the Study of Intracranial Vascularity: State of the Field and Future Directions. Am J Neuroradiol 41: 2-9. https://doi.org/10.3174/ajnr.A6344
    [30] Zong F, Du J, Deng X, et al. (2021) Fast Diffusion Kurtosis Mapping of Human Brain at 7 Tesla With Hybrid Principal Component Analyses. IEEE Access 9: 107965-107975. https://doi.org/10.1109/ACCESS.2021.3100546
    [31] Chu X, Wu P, Yan H, et al. (2022) Comparison of brain microstructure alterations on diffusion kurtosis imaging among Alzheimer's disease, mild cognitive impairment, and cognitively normal individuals. Front Aging Neurosci 14: 919143. https://doi.org/10.3389/fnagi.2022.919143
    [32] McKiernan EF, O'Brien JT (2017) 7T MRI for neurodegenerative dementias in vivo: a systematic review of the literature. J Neurol Neurosur Ps 88: 564-574. https://doi.org/10.1136/jnnp-2016-315022
    [33] Giuliano A, Donatelli G, Cosottini M, et al. (2017) Hippocampal subfields at ultra high field MRI: An overview of segmentation and measurement methods. Hippocampus 27: 481-494. https://doi.org/10.1002/hipo.22717
    [34] Kenkhuis B, Jonkman LE, Bulk M, et al. (2019) 7T MRI allows detection of disturbed cortical lamination of the medial temporal lobe in patients with Alzheimer's disease. NeuroImage Clin 21: 101665. https://doi.org/10.1016/j.nicl.2019.101665
    [35] Ferreira D, Pereira JB, Volpe G, et al. (2019) Subtypes of Alzheimer's Disease Display Distinct Network Abnormalities Extending Beyond Their Pattern of Brain Atrophy. Front Neuro 10: 524. https://doi.org/10.3389/fneur.2019.00524
    [36] Boutet C, Chupin M, Lehéricy S, et al. (2014) Detection of volume loss in hippocampal layers in Alzheimer's disease using 7 T MRI: a feasibility study. NeuroImage Clin 5: 341-348. https://doi.org/10.1016/j.nicl.2014.07.011
    [37] Balchandani P, Naidich TP (2015) Ultra-High-Field MR Neuroimaging. Am J Neuroradiol 36: 1204-1215. https://doi.org/10.3174/ajnr.A4180
    [38] Riphagen JM, Schmiedek L, Gronenschild EHBM, et al. (2020) Associations between pattern separation and hippocampal subfield structure and function vary along the lifespan: A 7 T imaging study. Sci Rep 10: 7572. https://doi.org/10.1038/s41598-020-64595-z
    [39] Kamsu JM, Constans JM, Lamberton F, et al. (2013) Structural layers of ex vivo rat hippocampus at 7T MRI. PloS One 8: e76135. https://doi.org/10.1371/journal.pone.0076135
    [40] Yin JX, Turner GH, Lin HJ, et al. (2011) Deficits in spatial learning and memory is associated with hippocampal volume loss in aged apolipoprotein E4 mice. J Alzheimers Dis 27: 89-98. https://doi.org/10.3233/JAD-2011-110479
    [41] Zhou X, Huang J, Pan S, et al. (2016) Neurodegeneration-Like Pathological and Behavioral Changes in an AAV9-Mediated p25 Overexpression Mouse Model. J Alzheimers Dis 53: 843-855. https://doi.org/10.3233/JAD-160191
    [42] Wisse LEM, Biessels GJ, Heringa SM, et al. (2014) Hippocampal subfield volumes at 7T in early Alzheimer's disease and normal aging. Neurobiol Aging 35: 2039-2045. https://doi.org/10.1016/j.neurobiolaging.2014.02.021
    [43] Blom K, Koek HL, Zwartbol MHT, et al. (2020) Vascular Risk Factors of Hippocampal Subfield Volumes in Persons without Dementia: The Medea 7T Study. J Alzheimers Dis 77: 1223-1239. https://doi.org/10.3233/JAD-200159
    [44] Chen Y, Chen T, Hou R (2022) Locus coeruleus in the pathogenesis of Alzheimer's disease: A systematic review. Alzh Dement 8: e12257. https://doi.org/10.1002/trc2.12257
    [45] Priovoulos N, Jacobs HIL, Ivanov D, et al. (2018) High-resolution in vivo imaging of human locus coeruleus by magnetization transfer MRI at 3T and 7T. NeuroImage 168: 427-436. https://doi.org/10.1016/j.neuroimage.2017.07.045
    [46] Tuzzi E, Balla DZ, Loureiro JRA, et al. (2020) Ultra-High Field MRI in Alzheimer's Disease: Effective Transverse Relaxation Rate and Quantitative Susceptibility Mapping of Human Brain In Vivo and Ex Vivo compared to Histology. J Alzheimers Dis 73: 1481-1499. https://doi.org/10.3233/JAD-190424
    [47] van Rooden S, Versluis MJ, Liem MK, et al. (2014) Cortical phase changes in Alzheimer's disease at 7T MRI: a novel imaging marker. Alzheimers Dement 10: e19-e26. https://doi.org/10.1016/j.jalz.2013.02.002
    [48] Cai K, Tain R, Das S, et al. (2015) The feasibility of quantitative MRI of perivascular spaces at 7T. J Neurosci Meth 256: 151-156. https://doi.org/10.1016/j.jneumeth.2015.09.001
    [49] van Rooden S, Doan NT, Versluis MJ, et al. (2015) 7T T2*-weighted magnetic resonance imaging reveals cortical phase differences between early- and late-onset Alzheimer's disease. Neurobiol Aging 36: 20-26. https://doi.org/10.1016/j.neurobiolaging.2014.07.006
    [50] van Rooden S, Buijs M, van Vliet ME, et al. (2016) Cortical phase changes measured using 7-T MRI in subjects with subjective cognitive impairment, and their association with cognitive function. NMR Biomed 29: 1289-1294. https://doi.org/10.1002/nbm.3248
    [51] van Bergen JM, Li X, Hua J, et al. (2016) Colocalization of cerebral iron with Amyloid beta in Mild Cognitive Impairment. Sci Rep 6: 35514. https://doi.org/10.1038/srep35514
    [52] Nakada T, Matsuzawa H, Igarashi H, et al. (2008) In vivo visualization of senile-plaque-like pathology in Alzheimer's disease patients by MR microscopy on a 7T system. J Neuroimaging 18: 125-129. https://doi.org/10.1111/j.1552-6569.2007.00179.x
    [53] Bulk M, Abdelmoula WM, Nabuurs RJA, et al. (2018) Postmortem MRI and histology demonstrate differential iron accumulation and cortical myelin organization in early- and late-onset Alzheimer's disease. Neurobiol Aging 62: 231-242. https://doi.org/10.1016/j.neurobiolaging.2017.10.017
    [54] Zeineh MM, Chen Y, Kitzler HH, et al. (2015) Activated iron-containing microglia in the human hippocampus identified by magnetic resonance imaging in Alzheimer disease. Neurobiol Aging 36: 2483-2500. https://doi.org/10.1016/j.neurobiolaging.2015.05.022
    [55] van Rooden S, Goos JD, van Opstal AM, et al. (2014) Increased number of microinfarcts in Alzheimer disease at 7-T MR imaging. Radiology 270: 205-211. https://doi.org/10.1148/radiol.13130743
    [56] Rowe CC, Villemagne VL (2011) Brain amyloid imaging. J Nucl Med 52: 1733-1740. https://doi.org/10.2967/jnumed.110.076315
    [57] Schreiner SJ, Liu X, Gietl AF, et al. (2014) Regional Fluid-Attenuated Inversion Recovery (FLAIR) at 7 Tesla correlates with amyloid beta in hippocampus and brainstem of cognitively normal elderly subjects. Front Aging Neurosci 6: 240. https://doi.org/10.3389/fnagi.2014.00240
    [58] van Veluw SJ, Zwanenburg JJ, Rozemuller AJ, et al. (2015) The spectrum of MR detectable cortical microinfarcts: a classification study with 7-tesla postmortem MRI and histopathology. J Cerebr Blood F Met 35: 676-683. https://doi.org/10.1038/jcbfm.2014.258
    [59] Conijn MM, Geerlings MI, Biessels GJ, et al. (2011) Cerebral microbleeds on MR imaging: comparison between 1.5 and 7T. Am J Neuroradiol 32: 1043-1049. https://doi.org/10.3174/ajnr.A2450
    [60] Brundel M, Heringa SM, de Bresser J, et al. (2012) High prevalence of cerebral microbleeds at 7Tesla MRI in patients with early Alzheimer's disease. J Alzheimers Dis 31: 259-263. https://doi.org/10.3233/JAD-2012-120364
    [61] van Veluw SJ, Biessels GJ, Klijn CJ, et al. (2016) Heterogeneous histopathology of cortical microbleeds in cerebral amyloid angiopathy. Neurology 86: 867-871. https://doi.org/10.1212/WNL.0000000000002419
    [62] Ni J, Auriel E, Martinez-Ramirez S, et al. (2015) Cortical localization of microbleeds in cerebral amyloid angiopathy: an ultra high-field 7T MRI study. J Alzheimers Dis 43: 1325-1330. https://doi.org/10.3233/JAD-140864
    [63] Hütter BO, Altmeppen J, Kraff O, et al. (2020) Higher sensitivity for traumatic cerebral microbleeds at 7 T ultra-high field MRI: is it clinically significant for the acute state of the patients and later quality of life?. Ther Adv Neurol Diso 13. https://doi.org/10.1177/1756286420911295
    [64] Uğurbil K, Adriany G, Andersen P, et al. (2003) Ultrahigh field magnetic resonance imaging and spectroscopy. Magn Reson Imaging 21: 1263-1281. https://doi.org/10.1016/j.mri.2003.08.027
    [65] Terpstra M, Cheong I, Lyu T, et al. (2016) Test-retest reproducibility of neurochemical profiles with short-echo, single-voxel MR spectroscopy at 3T and 7T. Magn Reson Med 76: 1083-91. https://doi.org/10.1002/mrm.26022
    [66] McKay J, Tkáč I (2016) Quantitative in vivo neurochemical profiling in humans: where are we now?. Int J Epidemiol 45: 1339-50. https://doi.org/10.1093/ije/dyw235
    [67] Qin L, Gao J (2021) New avenues for functional neuroimaging: ultra-high field MRI and OPM-MEG. Psychoradiology 1: 165-171. https://doi.org/10.1093/psyrad/kkab014
    [68] Haeger A, Bottlaender M, Lagarde J, et al. (2021) What can 7T sodium MRI tell us about cellular energy depletion and neurotransmission in Alzheimer's disease?. Alzheimers 17: 1843-1854. https://doi.org/10.1002/alz.12501
    [69] Oeltzschner G, Wijtenburg SA, Mikkelsen M, et al. (2019) Neurometabolites and associations with cognitive deficits in mild cognitive impairment: a magnetic resonance spectroscopy study at 7 Tesla. Neurobiol Aging 73: 211-218. https://doi.org/10.1016/j.neurobiolaging.2018.09.027
    [70] Quevenco FC, Schreiner SJ, Preti MG, et al. (2019) GABA and glutamate moderate beta-amyloid related functional connectivity in cognitively unimpaired old-aged adults. NeuroImage Clin 22: 101776. https://doi.org/10.1016/j.nicl.2019.101776
    [71] Henning A, Fuchs A, Murdoch JB (2009) Slice-selective FID acquisition, localized by outer volume suppression (FIDLOVS) for (1)H-MRSI of the human brain at 7 T with minimal signal loss. NMR Biomed 22: 683-696. https://doi.org/10.1002/nbm.1366
    [72] Haris M, Nath K, Cai K, et al. (2013) Imaging of glutamate neurotransmitter alterations in Alzheimer's disease. NMR Biomed 26: 386-391. https://doi.org/10.1002/nbm.2875
    [73] Cember ATJ, Nanga RPR, Reddy R (2022) Glutamate-weighted CEST (gluCEST) imaging for mapping neurometabolism: An update on the state of the art and emerging findings from in vivo applications. NMR Biomed e4780. [Advance online publication]. https://doi.org/10.1002/nbm.4780
    [74] Crescenzi R, DeBrosse C, Nanga RP, et al. (2017) Longitudinal imaging reveals subhippocampal dynamics in glutamate levels associated with histopathologic events in a mouse model of tauopathy and healthy mice. Hippocampus 27: 285-302. https://doi.org/10.1002/hipo.22693
    [75] Crescenzi R, DeBrosse C, Nanga RP, et al. (2014) In vivo measurement of glutamate loss is associated with synapse loss in a mouse model of tauopathy. NeuroImage 101: 185-192. https://doi.org/10.1016/j.neuroimage.2014.06.067
    [76] Haris M, Cai K, Singh A, et al. (2011) In vivo mapping of brain myo-inositol. NeuroImage 54: 2079-2085. https://doi.org/10.1016/j.neuroimage.2010.10.017
    [77] Marjańska M, McCarten JR, Hodges JS, et al. (2019) Distinctive Neurochemistry in Alzheimer's Disease via 7 T In Vivo Magnetic Resonance Spectroscopy. J Alzheimers Dis 68: 559-569. https://doi.org/10.3233/JAD-180861
    [78] Zenaro E, Piacentino G, Constantin G (2017) The blood-brain barrier in Alzheimer's disease. Neurobiol Dis 107: 41-56. https://doi.org/10.1016/j.nbd.2016.07.007
    [79] Rezai-Zadeh K, Gate D, Szekely CA, et al. (2009) Can peripheral leukocytes be used as Alzheimer's disease biomarkers?. Expert Rev Neurother 9: 1623-1633. https://doi.org/10.1586/ern.09.118
    [80] Robbins M, Clayton E, Kaminski Schierle GS (2021) Synaptic tau: A pathological or physiological phenomenon?. Acta Neuropathol Commun 9: 149. https://doi.org/10.1186/s40478-021-01246-y
    [81] Šišková Z, Justus D, Kaneko H, et al. (2014) Dendritic structural degeneration is functionally linked to cellular hyperexcitability in a mouse model of alzheimer's disease. Neuron 84: 1023-1033. https://doi.org/10.1016/j.neuron.2014.10.024
    [82] Palop JJ, Mucke L (2016) Network abnormalities and interneuron dysfunction in Alzheimer disease. Nat Rev Neurosci 17: 777-792. https://doi.org/10.1038/nrn.2016.141
    [83] Shaaban CE, Aizenstein HJ, Jorgensen DR, et al. (2017) In Vivo Imaging of Venous Side Cerebral Small-Vessel Disease in Older Adults: An MRI Method at 7T. Am J Neuroradiol 38: 1923-1928. https://doi.org/10.3174/ajnr.A5327
    [84] Poduslo JF, Wengenack TM, Curran GL, et al. (2002) Molecular targeting of Alzheimer's amyloid plaques for contrast-enhanced magnetic resonance imaging. Neurobiol Dis 11: 315-329. https://doi.org/10.1006/nbdi.2002.0550
    [85] Arachchige ASPM (2023) Transitioning from PET/MR to trimodal neuroimaging: why not cover the temporal dimension with EEG?. AIMS Neurosci 10: 1-4. https://doi.org/10.3934/Neuroscience.2023001
    [86] Duyn JH (2012) The future of ultra-high field MRI and fMRI for study of the human brain. NeuroImage 62: 1241-1248. https://doi.org/10.1016/j.neuroimage.2011.10.065
    [87] Biagi L, Cosottini M, Tosetti M (2017) 7 T MR: from basic research to human applications. High Field Brain MRI . Cham: Springer 373-83. https://doi.org/10.1007/978-3-319-44174-0_23
    [88] Ali R, Goubran M, Choudhri O, et al. (2015) Seven-Tesla MRI and neuroimaging biomarkers for Alzheimer's disease. Neurosurg Focus 39: E4. https://doi.org/10.3171/2015.9.FOCUS15326
    [89] van Gemert J, Brink W, Webb A, et al. (2019) High-permittivity pad design tool for 7T neuroimaging and 3T body imaging. Magn Reson Med 81: 3370-3378. https://doi.org/10.1002/mrm.27629
    [90] Uwano I, Kudo K, Yamashita F, et al. (2014) Intensity inhomogeneity correction for magnetic resonance imaging of human brain at 7T. Med Phys 41: 022302. https://doi.org/10.1118/1.4860954
    [91] Truong TK, Chakeres DW, Beversdorf DQ, et al. (2006) Effects of static and radiofrequency magnetic field inhomogeneity in ultra-high field magnetic resonance imaging. Magn Reson Imaging 24: 103-112. https://doi.org/10.1016/j.mri.2005.09.013
    [92] Trattnig S, Springer E, Bogner W, et al. (2018) Key clinical benefits of neuroimaging at 7T. NeuroImage 168: 477-489. https://doi.org/10.1016/j.neuroimage.2016.11.031
    [93] van Gelderen P, de Zwart JA, Starewicz P, et al. (2007) Real-time shimming to compensate for respiration-induced B0 fluctuations. Magn Reson Med 57: 362-368. https://doi.org/10.1002/mrm.211369
    [94] Versluis MJ, Peeters JM, van Rooden S, et al. (2010) Origin and reduction of motion and f0 artifacts in high resolution T2*-weighted magnetic resonance imaging: application in Alzheimer's disease patients. NeuroImage 51: 1082-1088. https://doi.org/10.1016/j.neuroimage.2010.03.048
    [95] Perera Molligoda Arachchige AS (2023) Neuroimaging with PET/MR: moving beyond 3T in preclinical systems, when for clinical practice?. Clin Trans Imaging (Springer) . Advance online publication
    [96] Yuan Y, Gu ZX, Wei WS (2009) Fluorodeoxyglucose-positron-emission tomography, single-photon emission tomography, and structural MR imaging for prediction of rapid conversion to Alzheimer disease in patients with mild cognitive impairment: a meta-analysis. Am J Neuroradiol 30: 404-410. https://doi.org/10.3174/ajnr.A1357
    [97] Perera Molligoda Arachchige AS (2021) What must be done in case of a dense collection?. Radiol Med 126: 1657-1658. https://doi.org/10.1007/s11547-021-01426-9
    [98] Verma Y, Ramesh S, Perera Molligoda Arachchige AS (2023) 7 T Versus 3 T in the Diagnosis of Small Unruptured Intracranial Aneurysms: Reply to Radojewski et al. Clin Neuroradiol . https://doi.org/10.1007/s00062-023-01321-y
  • This article has been cited by:

    1. Priyankar Chand, Suryendu Dutta, Suparna Mukherji, Characterization and biodegradability assessment of water-soluble fraction of oily sludge using stir bar sorptive extraction and GCxGC-TOF MS, 2022, 304, 02697491, 119177, 10.1016/j.envpol.2022.119177
    2. Tamer Hafez, Maren Ortiz-Zarragoitia, Christine Cagnon, Cristiana Cravo-Laureau, Robert Duran, Cold sediment microbial community shifts in response to crude oil water-accommodated fraction with or without dispersant: a microcosm study, 2023, 1614-7499, 10.1007/s11356-023-25264-6
    3. Alice C. Ortmann, Susan E. Cobanli, Gary Wohlgeschaffen, Ho Yin Poon, Camilla Ryther, Charles W. Greer, Jessica Wasserscheid, Miria Elias, Brian Robinson, Thomas L. King, Factors that affect water column hydrocarbon concentrations have minor impacts on microbial responses following simulated diesel fuel spills, 2023, 194, 0025326X, 115358, 10.1016/j.marpolbul.2023.115358
    4. Ho Yin Poon, Charles W. Greer, Jessica Wasserscheid, Miria Elias, Taylor Watts, Gary Wohlgeschaffen, Susan E. Cobanli, Brian Robinson, Thomas L. King, Alice C. Ortmann, Measuring the Fate and Natural Attenuation Potential of a Viscous Marine Fuel on an Artificial Beach Mesocosm, 2024, 11, 2198-7491, 10.1007/s40710-024-00711-9
  • Reader Comments
  • © 2023 the Author(s), licensee AIMS Press. This is an open access article distributed under the terms of the Creative Commons Attribution License (http://creativecommons.org/licenses/by/4.0)
通讯作者: 陈斌, bchen63@163.com
  • 1. 

    沈阳化工大学材料科学与工程学院 沈阳 110142

  1. 本站搜索
  2. 百度学术搜索
  3. 万方数据库搜索
  4. CNKI搜索

Metrics

Article views(2616) PDF downloads(110) Cited by(7)

Article outline

Figures and Tables

Figures(6)

/

DownLoad:  Full-Size Img  PowerPoint
Return
Return

Catalog