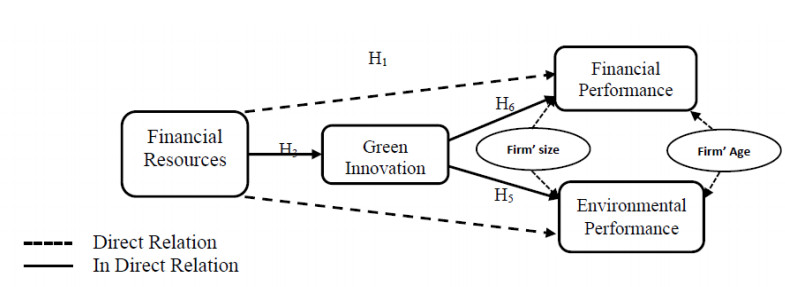
The current study investigates the influence of financial resources on environmental and financial performance with the mediating role of green practices (innovation) in manufacturing firms of the emerging economy, Pakistan. The research model and its proposed hypothesis was using 294 manufacturing firms' samples, for fruitful insights, the hypothesis was tested through a structured equation model using Smart PLS 3. Our results exhibited a positive and significant impact of financial resources on financial performance but not on environmental performance. However, green innovation fully mediates the relationship between financial resources and financial performance, while partially mediate the relationship between financial resources and environmental performance. Considering our insight, we suggest to the government that financially support the SMEs sector because they have a lack of tangible and intangible resources due to small size, and to easily adapt the green practices.
Citation: Rizwan Ullah Khan, Hina Arif, Noor E Sahar, Arif Ali, Munir A. Abbasi. The role of financial resources in SMEs' financial and environmental performance; the mediating role of green innovation[J]. Green Finance, 2022, 4(1): 36-53. doi: 10.3934/GF.2022002
The current study investigates the influence of financial resources on environmental and financial performance with the mediating role of green practices (innovation) in manufacturing firms of the emerging economy, Pakistan. The research model and its proposed hypothesis was using 294 manufacturing firms' samples, for fruitful insights, the hypothesis was tested through a structured equation model using Smart PLS 3. Our results exhibited a positive and significant impact of financial resources on financial performance but not on environmental performance. However, green innovation fully mediates the relationship between financial resources and financial performance, while partially mediate the relationship between financial resources and environmental performance. Considering our insight, we suggest to the government that financially support the SMEs sector because they have a lack of tangible and intangible resources due to small size, and to easily adapt the green practices.

| [1] |
Ali S, Li G, Yang P, et al. (2020) Unpacking the importance of intangible skills in new product development and sustainable business performance; strategies for marketing managers. PloS One 15: e0238743. https://doi.org/10.1371/journal.pone.0238743 doi: 10.1371/journal.pone.0238743

|
| [2] |
Alkahtani A, Nordin N, Khan RU (2020) Does government support enhance the relation between networking structure and sustainable competitive performance among SMEs? J Innovation Entrep 9: 1–16. https://doi.org/10.1186/s13731-020-00127-3 doi: 10.1186/s13731-020-00127-3
|
| [3] |
Anwar M, Li S (2021) Spurring competitiveness, financial and environmental performance of SMEs through government financial and non-financial support. Environ Dev Sustainability 23: 7860–7882. https://doi.org/10.1007/s10668-020-00951-3 doi: 10.1007/s10668-020-00951-3
|
| [4] |
Aragón-Correa JA, Hurtado-Torres N, Sharma S, et al. (2008) Environmental strategy and performance in small firms: A resource-based perspective. J Environ Manage 86: 88–103. https://doi.org/10.1016/j.jenvman.2006.11.022 doi: 10.1016/j.jenvman.2006.11.022
|
| [5] |
Aranda-Usón A, Portillo-Tarragona P, Marín-Vinuesa LM, et al. (2019) Financial resources for the circular economy: A perspective from businesses. Sustainability 11: 888. https://doi.org/10.3390/su11030888 doi: 10.3390/su11030888
|
| [6] |
Banerjee SB (2001) Managerial perceptions of corporate environmentalism: Interpretations from industry and strategic implications for organizations. J Manage Stud 38: 489–513. https://doi.org/10.1111/1467-6486.00246 doi: 10.1111/1467-6486.00246
|
| [7] |
Barney J (1991) Firm resources and sustained competitive advantage. J Manage 17: 99–120. https://doi.org/10.1177/014920639101700108 doi: 10.1177/014920639101700108
|
| [8] |
Barney JB (2001) Resource-based theories of competitive advantage: A ten-year retrospective on the resource-based view. J Manage 27: 643–650. https://doi.org/10.1177/014920630102700602 doi: 10.1177/014920630102700602
|
| [9] |
Beliaeva T, Shirokova G, Wales W, et al. (2020) Benefiting from economic crisis? Strategic orientation effects, trade-offs, and configurations with resource availability on SME performance. Int Entrep Manage J 16: 165–194. https://doi.org/10.1007/s11365-018-0499-2 doi: 10.1007/s11365-018-0499-2
|
| [10] |
Betts TK, Super JF, North J (2018) Exploring the influence of institutional pressures and production capability on the environmental practices-Environmental performance relationship in advanced and developing economies. J Clean Prod 187: 1082–1093. https://doi.org/10.1016/j.jclepro.2018.03.186 doi: 10.1016/j.jclepro.2018.03.186
|
| [11] |
Biosca O, McHugh N, Ibrahim F, et al. (2020) Walking a tightrope: using financial diaries to investigate day-to-day financial decisions and the social safety net of the financially excluded. Ann Am Acad Pol Soc Sci 689: 46–64. https://doi.org/10.1177/0002716220921154 doi: 10.1177/0002716220921154
|
| [12] |
Cao H, Chen Z (2019) The driving effect of internal and external environment on green innovation strategy-The moderating role of top management's environmental awareness. Nankai Bus Rev Int 10: 342–361. https://doi.org/10.1108/NBRI-05-2018-0028 doi: 10.1108/NBRI-05-2018-0028
|
| [13] |
Ch'ng PC, Cheah J, Amran A (2021) Eco-innovation practices and sustainable business performance: The moderating effect of market turbulence in the Malaysian technology industry. J Clean Prod 283: 124556. https://doi.org/10.1016/j.jclepro.2020.124556 doi: 10.1016/j.jclepro.2020.124556
|
| [14] |
Chen S, Wang Y, Albitar K, et al. (2021) Does ownership concentration affect corporate environmental responsibility engagement? The mediating role of corporate leverage. Borsa Istanb Rev 21: 13–24. https://doi.org/10.1016/j.bir.2021.02.001 doi: 10.1016/j.bir.2021.02.001
|
| [15] |
Chen YS, Lai SB, Wen CT (2006) The influence of green innovation performance on corporate advantage in Taiwan. J Bus Ethics 67: 331–339. https://doi.org/10.1007/s10551-006-9025-5 doi: 10.1007/s10551-006-9025-5
|
| [16] |
Clohessy T, Acton T (2019) Investigating the influence of organizational factors on blockchain adoption: An innovation theory perspective. Ind Manage Data Syst 119: 1457–1491. https://doi.org/10.1108/IMDS-08-2018-0365 doi: 10.1108/IMDS-08-2018-0365
|
| [17] |
Daily BF, Bishop JW, Steiner R (2007) The mediating role of EMS teamwork as it pertains to HR factors and perceived environmental performance. J Appl Bus Res 23: 95–110. https://doi.org/10.19030/jabr.v23i1.1411 doi: 10.19030/jabr.v23i1.1411
|
| [18] |
Dias A, Rodrigues LL, Craig R, et al. (2018) Corporate social responsibility disclosure in small and medium-sized entities and large companies. Soc Responsib J 15: 137–154. https://doi.org/10.1108/SRJ-05-2017-0090 doi: 10.1108/SRJ-05-2017-0090
|
| [19] |
Friedline T, Chen Z (2021) Families' financial stress & well-being: The importance of the economy and economic environments. J Fam Econ Issues 42: 34–51. https://doi.org/10.1007/s10834-020-09694-9 doi: 10.1007/s10834-020-09694-9
|
| [20] | George D (2011) SPSS for windows step by step: A simple study guide and reference, 17.0 update, 10/e. Pearson Education India. Available from: https://lib.ugent.be/catalog/rug01:001424067 |
| [21] |
Gohoungodji P, N'Dri AB, Latulippe JM, et al. (2020) What is stopping the automotive industry from going green? A systematic review of barriers to green innovation in the automotive industry. J Clean Prod 277: 123524. https://doi.org/10.1016/j.jclepro.2020.123524 doi: 10.1016/j.jclepro.2020.123524
|
| [22] |
Golicic SL, Smith CD (2013) A meta‐analysis of environmentally sustainable supply chain management practices and firm performance. J Supply Chain Manage 49: 78–95. https://doi.org/10.1111/jscm.12006 doi: 10.1111/jscm.12006
|
| [23] |
Guerrero-Villegas J, Sierra-García L, Palacios-Florencio B (2018) The role of sustainable development and innovation on firm performance. Corp Soc Responsib Environ Manage 25: 1350–1362. https://doi.org/10.1002/csr.1644 doi: 10.1002/csr.1644
|
| [24] |
Gupta H, Barua MK (2018). A framework to overcome barriers to green innovation in SMEs using BWM and Fuzzy TOPSIS. Sci Total Environ 633: 122–139. https://doi.org/10.1016/j.scitotenv.2018.03.173 doi: 10.1016/j.scitotenv.2018.03.173
|
| [25] |
Hair Jr JF, Hult GTM, Ringle CM, et al. (2021) A primer on partial least squares structural equation modeling (PLS-SEM). SAGE. https://doi.org/10.1007/978-3-030-80519-7 doi: 10.1007/978-3-030-80519-7
|
| [26] |
Hair Jr JF, Sarstedt M, Ringle CM, et al. (2017) Advanced issues in partial least squares structural equation modeling. SAGE. https://doi.org/10.15358/9783800653614 doi: 10.15358/9783800653614
|
| [27] |
Haque F, Ntim CG (2018) Environmental policy, sustainable development, governance mechanisms and environmental performance. Bus Strategy Environ 27: 415–435. https://doi.org/10.1002/bse.2007 doi: 10.1002/bse.2007
|
| [28] |
Herrera Madueno J, Larran Jorge M, Lechuga Sancho MP, et al. (2016) Corporate social responsibility practices in Spanish small and medium businesses: Explanatory factors analysis. Rev Contab 19: 31–44. https://doi.org/10.1016/j.rcsar.2014.10.003 doi: 10.1016/j.rcsar.2014.10.003
|
| [29] |
Hong M, Drakeford B, Zhang K (2020) The impact of mandatory CSR disclosure on green innovation: evidence from China. Green Financ 2: 302–322. https://doi.org/10.3934/GF.2020017 doi: 10.3934/GF.2020017
|
| [30] |
Hu Z, Wei Z, Ma X, et al. (2020) Multi-parameter deep-perception and many-objective autonomous-control of rolling schedule on high speed cold tandem mill. ISA Trans 102: 193–207. https://doi.org/10.1016/j.isatra.2020.02.024 doi: 10.1016/j.isatra.2020.02.024
|
| [31] |
Huang SZ, Chau KY, Chien F, et al. (2020) The Impact of Startups' Dual Learning on Their Green Innovation Capability: The Effects of Business Executives' Environmental Awareness and Environmental Regulations. Sustainability 12: 6526. https://doi.org/10.3390/su12166526 doi: 10.3390/su12166526
|
| [32] |
Khan NU, Anwar M, Li S, et al. (2021) Intellectual capital, financial resources, and green supply chain management as predictors of financial and environmental performance. Environ Sci Pollut Res 28: 19755–19767. https://doi.org/10.1007/s11356-020-12243-4 doi: 10.1007/s11356-020-12243-4
|
| [33] |
Khan PA, Johl SK, Johl SK (2021) Does adoption of ISO 56002‐2019 and green innovation reporting enhance the firm sustainable development goal performance? An emerging paradigm. Bus Strategy Environ 30: 1–15. https://doi.org/10.1002/bse.2779 doi: 10.1002/bse.2779
|
| [34] |
Khan RU (2019) Relationship of HR practices and career path: A perspective of accounting studies. J Bus Rev 7: 46-56. https://doi.org/10.53369/AERI1679 doi: 10.53369/AERI1679
|
| [35] |
Khan RU, Salamzadeh Y, Shah SZA, et al. (2021) Factors affecting women entrepreneurs' success: a study of small-and medium-sized enterprises in emerging market of Pakistan. J Innov Entrep 10: 1–21. https://doi.org/10.1186/s13731-021-00145-9 doi: 10.1186/s13731-021-00145-9
|
| [36] |
Khan RU, Salamzadeh Y, Kawamorita H, et al. (2021) Entrepreneurial Orientation and Small and Medium-sized Enterprises' Performance; Does 'Access to Finance' Moderate the Relation in Emerging Economies? Vision 25: 88–102. https://doi.org/10.1177/0972262920954604 doi: 10.1177/0972262920954604
|
| [37] |
Khan SZ, Yang Q, Waheed A (2019) Investment in intangible resources and capabilities spurs sustainable competitive advantage and firm performance. Corp Soc Responsib Environ Manage 26: 285–295. https://doi.org/10.1002/csr.1678 doi: 10.1002/csr.1678
|
| [38] |
Khattak MS, Anwar M, Clauß T (2021) The Role of Entrepreneurial Finance in Corporate Social Responsibility and New Venture Performance in an Emerging Market. J Entrep 30: 336–366. https://doi.org/10.1177/09713557211025655 doi: 10.1177/09713557211025655
|
| [39] |
Kraus S, Rehman SU, García FJS (2020) Corporate social responsibility and environmental performance: The mediating role of environmental strategy and green innovation. Technol Forecast Soc Change 160: 120262. https://doi.org/10.1016/j.techfore.2020.120262 doi: 10.1016/j.techfore.2020.120262
|
| [40] |
Kweh QL, Ting IWK, Hanh LTM, et al. (2019) Intellectual capital, governmental presence, and firm performance of publicly listed companies in Malaysia. Int J Learn Intellect Cap 16: 193–211. https://doi.org/10.1504/IJLIC.2019.098932 doi: 10.1504/IJLIC.2019.098932
|
| [41] |
Lăzăroiu G, Ionescu L, Uță C, et al. (2020) Environmentally responsible behavior and sustainability policy adoption in green public procurement. Sustainability 12: 2110. https://doi.org/10.3390/su12052110 doi: 10.3390/su12052110
|
| [42] |
Li G, Luo Z, Anwar M, et al. (2020). Intellectual capital and the efficiency of SMEs in the transition economy China; Do financial resources strengthen the routes? PloS One 15: e0235462. https://doi.org/10.1371/journal.pone.0235462 doi: 10.1371/journal.pone.0235462
|
| [43] |
Li Z, Liao G, Albitar K (2020) Does corporate environmental responsibility engagement affect firm value? The mediating role of corporate innovation. Bus Strategy Environ 29: 1045–1055. https://doi.org/10.1002/bse.2416 doi: 10.1002/bse.2416
|
| [44] |
Liao G, Hou P, Shen X, et al. (2021) The impact of economic policy uncertainty on stock returns: The role of corporate environmental responsibility engagement. Int J Financ Econ 26: 4386–4392. https://doi.org/10.1002/ijfe.2020 doi: 10.1002/ijfe.2020
|
| [45] |
Lin WL, Cheah JH, Azali M, et al. (2019) Does firm size matter? Evidence on the impact of the green innovation strategy on corporate financial performance in the automotive sector. J Clean Prod 229: 974–988. https://doi.org/10.1016/j.jclepro.2019.04.214 doi: 10.1016/j.jclepro.2019.04.214
|
| [46] |
Mansoor A, Jahan S, Riaz M (2021) Does green intellectual capital spur corporate environmental performance through green workforce? J Intellect Cap 22: 823–839. https://doi.org/10.1108/JIC-06-2020-0181 doi: 10.1108/JIC-06-2020-0181
|
| [47] |
Melnyk SA, Sroufe RP, Calantone R (2003) Assessing the impact of environmental management systems on corporate and environmental performance. J Oper Manage 21: 329–351. https://doi.org/10.1016/S0272-6963(02)00109-2 doi: 10.1016/S0272-6963(02)00109-2
|
| [48] |
Memon A, Yong An Z, Memon MQ (2020) Does financial availability sustain financial, innovative, and environmental performance? Relation via opportunity recognition. Corp Soc Responsib Environ Manage 27: 562–575. https://doi.org/10.1002/csr.1820 doi: 10.1002/csr.1820
|
| [49] |
Monteiro AP, Soares AM, Rua OL (2017) Entrepreneurial orientation and export performance: the mediating effect of organizational resources and dynamic capabilities. J Int Bus Entrep Dev 10: 3–20. https://doi.org/10.1504/JIBED.2017.082749 doi: 10.1504/JIBED.2017.082749
|
| [50] |
Nanath K, Pillai RR (2017) The influence of green is practices on competitive advantage: Mediation role of green innovation performance. Inf Syst Manage 34: 3–19. https://doi.org/10.1080/10580530.2017.1254436 doi: 10.1080/10580530.2017.1254436
|
| [51] |
Pastakia A (1998) Grassroots ecopreneurs: change agents for a sustainable society. J Organ Change Manage 11: 157–173. https://doi.org/10.1108/09534819810212142 doi: 10.1108/09534819810212142
|
| [52] |
Permatasari N, Zona MA (2021) The Effect of financial compensation and career development on employee retention with non-physical work environments as moderating variables. Hum Resour Manage Stud 1: 131–140. https://doi.org/10.24036/hrms.v1i2.14 doi: 10.24036/hrms.v1i2.14
|
| [53] |
Pinelli M, Maiolini R (2017) Strategies for sustainable development: Organizational motivations, stakeholders' expectations and sustainability agendas. Sust Dev 25: 288–298. https://doi.org/10.1002/sd.1653 doi: 10.1002/sd.1653
|
| [54] |
Podsakoff PM, MacKenzie SB, Podsakoff NP (2012) Sources of method bias in social science research and recommendations on how to control it. Annu Rev Psychol 63: 539–569. https://doi.org/10.1146/annurev-psych-120710-100452 doi: 10.1146/annurev-psych-120710-100452
|
| [55] |
Pratono AH, Darmasetiawan NK, Yudiarso A, et al. (2019) Achieving sustainable competitive advantage through green entrepreneurial orientation and market orientation: The role of inter-organizational learning. Bottom Line 31(1): 2–15. https://doi.org/10.1108/BL-10-2018-0045 doi: 10.1108/BL-10-2018-0045
|
| [56] |
Qi G, Jia Y, Zou H (2021) Is institutional pressure the mother of green innovation? Examining the moderating effect of absorptive capacity. J Clean Prod 278: 123957. https://doi.org/10.1016/j.jclepro.2020.123957 doi: 10.1016/j.jclepro.2020.123957
|
| [57] |
Ramanathan R (2018) Understanding complexity: The curvilinear relationship between environmental performance and firm performance. J Bus Ethics 149: 383–393. https://doi.org/10.1007/s10551-016-3088-8 doi: 10.1007/s10551-016-3088-8
|
| [58] |
Raza A, Farrukh M, Iqbal MK, et al. (2021) Corporate social responsibility and employees' voluntary pro‐environmental behavior: The role of organizational pride and employee engagement. Corp Soc Responsib Environ Manage 28: 1104–1116. https://doi.org/10.1002/csr.2109 doi: 10.1002/csr.2109
|
| [59] |
Roscoe S, Subramanian N, Jabbour CJ, et al. (2019) Green human resource management and the enablers of green organisational culture: Enhancing a firm's environmental performance for sustainable development. Bus Strategy Environ 28: 737–749. https://doi.org/10.1002/bse.2277 doi: 10.1002/bse.2277
|
| [60] |
Ruggiero P, Cupertino S (2018) CSR strategic approach, financial resources and corporate social performance: The mediating effect of innovation. Sustainability 10: 3611. https://doi.org/10.3390/su10103611 doi: 10.3390/su10103611
|
| [61] |
Saade R, Thoumy M, Sakr O (2019) Green supply chain management adoption in Lebanese manufacturing industries: an exploratory study. Int J Logist Syst Manage 32: 520–547. https://doi.org/10.1504/IJLSM.2019.098334 doi: 10.1504/IJLSM.2019.098334
|
| [62] |
Sahoo S, Vijayvargy L (2020) Green supply chain management practices and its impact on organizational performance: evidence from Indian manufacturers. J Manuf Technol Manage 32: 862–886. https://doi.org/10.1108/JMTM-04-2020-0173 doi: 10.1108/JMTM-04-2020-0173
|
| [63] |
Santoro G, Ferraris A, Giacosa E, et al. (2018) How SMEs engage in open innovation: a survey. J Knowl Econ 9: 561–574. https://doi.org/10.1007/s13132-015-0350-8 doi: 10.1007/s13132-015-0350-8
|
| [64] |
Sellitto MA, Hermann FF (2019) Influence of green practices on organizational competitiveness: a study of the electrical and electronics industry. Eng Manage J 31: 98–112. https://doi.org/10.1080/10429247.2018.1522220 doi: 10.1080/10429247.2018.1522220
|
| [65] |
Sellitto MA, Hermann FF, Blezs Jr AE, et al. (2019) Describing and organizing green practices in the context of Green Supply Chain Management: Case studies. Resour Conserv Recycl 145: 1–10. https://doi.org/10.1016/j.resconrec.2019.02.013 doi: 10.1016/j.resconrec.2019.02.013
|
| [66] |
Shirokova G, Bogatyreva K, Beliaeva T, et al. (2016) Entrepreneurial orientation and firm performance in different environmental settings: contingency and configurational approaches. J Small Bus Enterp Dev 23: 703–727. https://doi.org/10.1108/JSBED-09-2015-0132 doi: 10.1108/JSBED-09-2015-0132
|
| [67] |
Şimsek H, Ozturk G (2021) Evaluation of the relationship between environmental accounting and business performance: the case of Istanbul province. Green Financ 3: 46–58. https://doi.org/10.3934/GF.2021004 doi: 10.3934/GF.2021004
|
| [68] |
Singh SK, Del Giudice M, Chierici R, et al. (2020) Green innovation and environmental performance: The role of green transformational leadership and green human resource management. Technol Forecast Soc Change 150: 119762. https://doi.org/10.1016/j.techfore.2019.119762 doi: 10.1016/j.techfore.2019.119762
|
| [69] |
Sobaih AEE, Hasanein A, Elshaer I (2020) Influences of green human resources management on environmental performance in small lodging enterprises: The role of green innovation. Sustainability 12: 10371. https://doi.org/10.3390/su122410371 doi: 10.3390/su122410371
|
| [70] |
Songling Y, Ishtiaq M, Anwar M, et al. (2018) The role of government support in sustainable competitive position and firm performance. Sustainability 10: 3495. https://doi.org/10.3390/su10103495 doi: 10.3390/su10103495
|
| [71] |
Sriviboon C, Jermsittiparsert K (2019) Influence of Human Resource Practices on Thai Pharmaceutical Firm Performance with Moderating Role of Job Involvement. Syst Rev Pharm 10: 234–243. https://doi.org/10.5530/srp.2019.2.32 doi: 10.5530/srp.2019.2.32
|
| [72] |
Utomo MN, Rahayu S, Kaujan K, et al. (2020) Environmental performance, environmental disclosure, and firm value: empirical study of non-financial companies at Indonesia Stock Exchange. Green Financ 2: 100–113. https://doi.org/10.3934/GF.2020006 doi: 10.3934/GF.2020006
|
| [73] |
Yong JY, Yusliza MY, Ramayah T, et al. (2020) Pathways towards sustainability in manufacturing organizations: Empirical evidence on the role of green human resource management. Bus Strat Environ 29: 212–228. https://doi.org/10.1002/bse.2359 doi: 10.1002/bse.2359
|
| [74] |
Zhang B, Wang Z (2014) Inter-firm collaborations on carbon emission reduction within industrial chains in China: practices, drivers and effects on firms' performances. Energy Econ 42: 115–131. https://doi.org/10.1016/j.eneco.2013.12.006 doi: 10.1016/j.eneco.2013.12.006
|


Figures(3) / Tables(5)

Rizwan Ullah Khan, Hina Arif, Noor E Sahar, Arif Ali, Munir A. Abbasi. The role of financial resources in SMEs' financial and environmental performance; the mediating role of green innovation[J]. Green Finance, 2022, 4(1): 36-53. doi: 10.3934/GF.2022002


 DownLoad: