Citation: Patrick Seeling. Augmented Reality Device Operator Cognitive Strain Determination and Prediction[J]. AIMS Electronics and Electrical Engineering, 2017, 1(1): 100-110. doi: 10.3934/ElectrEng.2017.1.100
[1] | Tobias Müller . Challenges in representing information with augmented reality to support manual procedural tasks. AIMS Electronics and Electrical Engineering, 2019, 3(1): 71-97. doi: 10.3934/ElectrEng.2019.1.71 |
[2] | Amleset Kelati, Hossam Gaber, Juha Plosila, Hannu Tenhunen . Implementation of non-intrusive appliances load monitoring (NIALM) on k-nearest neighbors (k-NN) classifier. AIMS Electronics and Electrical Engineering, 2020, 4(3): 326-344. doi: 10.3934/ElectrEng.2020.3.326 |
[3] | David B. Douglas, Robert E. Douglas, Cliff Wilke, David Gibson, John Boone, Max Wintermark . A systematic review of 3D cursor in the medical literature. AIMS Electronics and Electrical Engineering, 2018, 2(1): 1-11. doi: 10.3934/ElectrEng.2018.1.1 |
[4] | Ryan Anthony J. de Belen, Huyen Nguyen, Daniel Filonik, Dennis Del Favero, Tomasz Bednarz . A systematic review of the current state of collaborative mixed reality technologies: 2013–2018. AIMS Electronics and Electrical Engineering, 2019, 3(2): 181-223. doi: 10.3934/ElectrEng.2019.2.181 |
[5] | B Naresh Kumar, Jai Sukh Paul Singh . Intelligence-based optimized cognitive radio routing for medical data transmission using IoT. AIMS Electronics and Electrical Engineering, 2022, 6(3): 223-246. doi: 10.3934/electreng.2022014 |
[6] | Rebecca M. Hein, Carolin Wienrich, Marc E. Latoschik . A systematic review of foreign language learning with immersive technologies (2001-2020). AIMS Electronics and Electrical Engineering, 2021, 5(2): 117-145. doi: 10.3934/electreng.2021007 |
[7] | Muamer M. Shebani, M. Tariq Iqbal, John E. Quaicoe . Comparison between alternative droop control strategy, modified droop method and control algorithm technique for parallel-connected converters. AIMS Electronics and Electrical Engineering, 2021, 5(1): 1-23. doi: 10.3934/electreng.2021001 |
[8] | Abdullah Yahya Abdullah Amer, Tamanna Siddiqu . A novel algorithm for sarcasm detection using supervised machine learning approach. AIMS Electronics and Electrical Engineering, 2022, 6(4): 345-369. doi: 10.3934/electreng.2022021 |
[9] | Suriya Priya R Asaithambi, Sitalakshmi Venkatraman, Ramanathan Venkatraman . Proposed big data architecture for facial recognition using machine learning. AIMS Electronics and Electrical Engineering, 2021, 5(1): 68-92. doi: 10.3934/electreng.2021005 |
[10] | Imad Ali, Faisal Ghaffar . Robust CNN for facial emotion recognition and real-time GUI. AIMS Electronics and Electrical Engineering, 2024, 8(2): 227-246. doi: 10.3934/electreng.2024010 |
Augmented reality (AR) or mixed reality (MR) approaches to augment the performance of device operators in several settings have attracted significant research interest and are seen as one of the main enablers of Industry 4.0 [1]. For industrial application scenarios in particular, the overlay of context-dependent information offers opportunities for new occupational configurations or training of the operators of AR/MR devices on-the-fly. This amalgamation of realities subsequently offers great potentials in various industry settings alike to positively modify human performance, indicated, e.g., by [2] for driving tasks, by [3] and [4] in the context of medical procedures, by [5] for museums and tourism, or by [6] for educational purposes. Psychological impacts, however, could yield a potential negative effect from the utilization of these devices types. The modification of the device operator performance could, for example, be negative due to too much information that requires processing. The result of this could be a negative performance impact due to increased cognitive strains for an operator.
We target this potentially negative impact scenario through an evaluation of a task that requires AR device operators to perform classification of media qualities. Specifically, operators were asked to rank the quality of differently impaired images presented in an AR setting, which requires different effort for discrimination of levels. One can consider the scenario in real life applications with the need to discern details in presented information, such as maintenance instruction or images detailing specific device features. A close approach is detailed in [22], where an AR content generating module creates virtual instructions from the assembly sequence of the specific product. In turn, untrained generalists become enabled to perform detailed activities otherwise requiring specialized training. However, this approach still requires detailed computer aided design files to derive the overall content. Our approach could be thought of as a more general version, where content is presented directly, e.g., in form of screen-shots or product manual images, or the likes. In turn, our contributions are (i) an evaluation of the overall cognitive strain of AR device operators when performing tasks and (ii) a classification into high and low cognitive load levels allowing for real-time adjustments of an operator's environment when performing tasks. While we focus on the content presentation components in this contribution, we note that in industrial settings, stressors can originate from a multitude of sources, such as limited time or noisy environments. Our study, thus, serves as an initial foray into the direct quantification of cognitive strain.
Several investigations into the capturing of cognitive strains were made in the past, with significant efforts put forth in educational contexts. For these scenarios, the skill acquisition of learners in any type of setting (including device operators in industrial environments acquiring new skills on-the-fly) represents a significant challenge. Learning theories, such as Cognitive Load Theory [7,8,9], provide a framework of memory and brain activities. The working memory and interdependent cognitive load has also attracted research efforts aiming at quantification of the underlying processes. Due to large inroads in human-computer interaction (HCI) that evolves around brain-computer interfaces (BCI) supported by electroencephalography (EEG), measurements of cognitive processes have become popular in research. For critical tasks, such as those where AR/MR might find explicit implementations in industrial processes, the impact that the HCI poses on a device operator through germane required cognitive processes, a deeper understanding of interplays is required [10]. While initial implementations of environmental augmentation under consideration of cognitive aspects have been proposed since quite some time, see, e.g., [17], these initial approaches required modification of the environment. Only in recent years have we witnessed an emergence of wearable augmented reality devices that allow for a blending of the physical world and information provided. In turn, considerations about the amount of information and its display within AR contexts has an interplay with the cognitive strain in the situation of utilization. Past research efforts were made to target this potential problem for industrial application scenarios. In [19], the authors evaluate task complexity for product development in a VR context with the help of graph theoretic approaches. Augmented reality considerations in design and manufacturing were showcased by [20] in an overview. More detailed, in [21], the authors introduce AR as a tool into the factory assembly workflow, employing markers and situational awareness to enable safe human-robot interaction during assembly processes.
Evaluations of computer utilization and cognitive or mental workloads has been the subject of research for quite some time. For example, frontal alpha and theta bands were identified as related to task difficulty, see, e.g., [11]. More recently, in [14] the authors analyzed the spectral analysis of EEG data with a focus on the alpha, beta, and theta bands. They find frontal cortex activity is high for cognitive work cycles and that the level of workload can be found reflected in the spectral density power levels. Similarly, a combination of theta and alpha bands was found to react to load levels in [13], where different load levels were successfully identified by a combination of frontal and parietal sensor locations. Specifically investigating the cognitive load in multimedia learning situations, it was found that different regions of the brain were activated for various tasks in different frequency bands in [12].
The recent advances in BCI allow for a reduced number of sensors to be utilized and similarly, dry electrodes enable non-intrusive designs to emerge in the near future. Specifically in this contribution, we consider a headband worn jointly with a head-worn AR device, which enables a combination of AR display and real-time sensing of EEG data when considering both current devices to be combined in future iterations. Such evaluations, though real-time, are actually nonintrusive in the utilization scenario with the benefit of real-time accessibility, whereas traditional experience sampling, such as with the NASA-TLX approach [18], are non-real-time and require an active participation of the human subjects.
The remainder of this article is structured as follows. In the following section, we describe our overall approach to the performance analysis. Our results are presented in Section 3 before a discussion and conclusion in Section 5.
In this section, we describe our overall approach in an overview first before detailing our data analysis methodologies.
The data we consider throughout this article is derived from human subject experiments and publicly available, see [15]. Specifically, participants were asked to rate multimedia quality levels of images (traditional and spherical) in a general meeting room setting with dimmed light. While the specific task given to the participants aims at determination of media quality, inherently the difficulty level for such rating can be extrapolated from the visual system based classification tasks required. In turn, we reason that the task difficulty level is especially complicated when considering unclear quality levels, derived from the visual fidelity of the media presented. In [15], the motivation was to determine the media quality from the captured EEG data, whereas in this paper, we evaluate the cognitive strain based on the complexity of the rating task.
The overall classification task asked participating human subjects to classify the quality of the images presented into 5 different quality levels on a Likert-type scale. Commonly, original and lowest impairment levels of media show no significant visual degradation and are easily classified. Similarly, the highest level of visual impairment also is relatively easy classified due to significant visual impairments. The harder to determine medium ranges of media fidelity, however, typically pose an increased cognitive load, as the classification in the medium ranges of visual impairments into three distinct categories can pose significant challenges. We subsequently map the different image levels to two cognitive load states, namely (i) no impairment, lowest impairment, and highest impairment levels are mapped to a low mental workload, whereas (ii) impairment levels 2–4 in the VIEW datasets [15] are mapped to a high mental workload.
We employ the available information contained in the dataset, which includes measurement data from four dry electrodes in the temporal-parietal and anterio-frontal positions (TP9, AF7, AF8, and TP10), illustrated in Figure 1.
We particularly focus on these electrode positions, as they could be readily integrated into future revisions of wearable AR device employing dry electrodes. Specifically, due to the sensor locations and wearable nature of AR devices, a merging of the currently employed headband and AR device would result in the ability of non-intrusive continuous monitoring in the future. The available data includes several different channel band measurements at the respective positions, namely:
• Low from 2.5–6.1 Hz,
• Delta from 1–4 Hz,
• Theta from 4–8 Hz,
• Alpha from 7.5–13 Hz,
• Beta from 13–30 Hz, and
• Gamma from 30–44 Hz.
As described in prior research efforts, especially the alpha, beta, and theta bands are of interest to identify different levels of cognitive load.
Motivated by the prior advances in the determination of workload levels in the literature, e.g., in [13], we employ the results from the VIEW datasets by utilizing basic machine learning approaches. Let the image presentation for a particular image i at workload level l, l∈{0,1} range from ts(i,l) to te(i,l). We subsequently aggregate the measurement data points for alpha (α), beta (β), and θ frequency bands at the different positions p as follows based on the coefficient of variation:
αcp=1+σ(αp)ˉαp, | (1) |
where σ(αp) denotes the standard deviation of the alpha band power and σ(αp) denotes the corresponding average at a specific sensor position. Noting that the beta and theta band values βcp and θcp are determined similarly, we employ these to determine their respective ratios. The approach results in four different scenarios, namely:
1. ˉαp╱ˉθp employing the average alpha/theta bands ratio to lean on past research efforts,
2. ˉαp╱ˉβp employing the average ratio of alpha and beta,
3. αcp╱θcp= ˉθp(1+σ(αp))ˉαp(1+σ(θp)) employing the variability of alpha and theta activity, and
4. αcp╱βcp= ˉβp(1+σ(αp))ˉαp(1+σ(βp)) employing the variability of alpha and beta activity while under testing conditions.
The resulting four position-dependent ratios are utilized as our main evaluation criteria using the k-nearest-neighbor (KNN) classification and regression approach to evaluate whether the ratio levels can be correctly employed to identify the different cognitive load levels. We selected the KNN approach as for this particular contribution, we are evaluating a basic classification approach to determine the workload levels of the subjects under consideration based on directly gathered sensor information.
We configure the classifier for 3 neighbors utilizing the distance between neighbors as weights, whereby the linear combination of the four position ratios is used. We note that in our evaluations, we evaluated different numbers of neighbors, but found that three was a sensible trade-off. We calculate the performance of the classification into high and low cognitive load levels based on the number of true positive (TP), true negative (TN), false negative (FN), and false positive (FP) classification and/or prediction results. Similarly, we determine the suitability of the classifier on the entire dataset using the R2 score, which in the case of this binary classification and prediction is the same as the precision attained by the approach.
In this section, we describe our results for the regression and prediction of the QoE/cognitive load interplay in greater detail. We initially focus on the complete set of experiments and users before separating them into the traditional AR-VIEW and immersive SAR-VIEW scenarios. Furthermore, we consider the four outlined scenarios, taking the overall levels and/or variabilities in the different frequency bands into account.
The initial classification for all subjects' cognitive load performance indicator for 1169 cases results in a perfect outcome, i.e., all cases are successfully classified as TP (585) or TN (584). Next, we consider the prediction of an individual user based on the KNN training set of all other users. This mimics the approach of predicting a new subjects' cognitive state from already known ones. In this scenario, we have to again differentiate between the four outlined approaches under consideration. The overall results are provided in Table 1.
ˉαp/ˉθp | ˉαp/ˉβp | αcp/θcp | αcp/βcp | |
TN | 9.67, 3.48 | 9.50, 3.46 | 9.60, 2.44 | 9.30, 4.42 |
TP | 9.63, 3.11 | 10.30, 3.41 | 10.07, 2.95 | 9.83, 4.67 |
FP | 9.87, 3.07 | 9.20, 3.55 | 9.43, 3.09 | 9.67, 4.10 |
FN | 9.83, 3.54 | 10.00, 3.80 | 9.87, 2.30 | 10.17, 4.51 |
R2 | 0.49, 0.09 | 0.51, 0.10 | 0.50, 0.09 | 0.49, 0.10 |
We observe that overall, the number of wrongly classified events is similar for all scenarios with only slight deviations. The inter-subject variability indicated by the standard deviation, however, suggests that these average results can vary significantly on a per subject basis. This is in line with the overall expected result for such a classification and prediction approach for highly subjective source data. Based on the R2score, our proposed ˉαp/ˉβp metric results in the highest average R2score overall.
We additionally consider the individual prediction of a subject's cognitive load based on the subject itself. Here, we perform a random 80/20 split of the available respective subject data into training and test data. Subsequently, we evaluate the performance of the KNN approach as in prior cases. We repeat the evaluation until the R2/accuracy score's 95% confidence interval width is within 5% of the mean. The results are presented in Table 2. We again observe a large spread of accuracies for the individual predictions across subjects. For example, the R2 for ˉαp/ˉθp exhibits a spread from 0.343 for subject 0 to 0.671 for subject 19. Overarching, our proposed variability metric αcp/βcp approach yields the highest level of prediction accuracy based on individual subjects themselves (M = 0.473, SD = 0.08). One potential drawback here can be the number of available data points on a per-subject basis, limiting the overall attainable results.
Subject | ˉαp/ˉθp | ˉαp/ˉβp | αcp/θcp | αcp/βcp |
1 | 0.343, 0.047 | 0.419, 0.050 | 0.351, 0.047 | 0.429, 0.050 |
2 | 0.488, 0.048 | 0.471, 0.050 | 0.419, 0.049 | 0.454, 0.048 |
3 | 0.450, 0.046 | 0.476, 0.047 | 0.484, 0.045 | 0.513, 0.048 |
4 | 0.547, 0.047 | 0.412, 0.050 | 0.654, 0.044 | 0.481, 0.050 |
5 | 0.454, 0.047 | 0.410, 0.049 | 0.424, 0.050 | 0.452, 0.048 |
6 | 0.544, 0.050 | 0.410, 0.047 | 0.480, 0.049 | 0.543, 0.049 |
7 | 0.451, 0.048 | 0.431, 0.049 | 0.532, 0.048 | 0.478, 0.047 |
8 | 0.360, 0.050 | 0.473, 0.047 | 0.475, 0.049 | 0.570, 0.047 |
9 | 0.451, 0.049 | 0.482, 0.048 | 0.571, 0.046 | 0.458, 0.049 |
10 | 0.437, 0.049 | 0.449, 0.048 | 0.530, 0.045 | 0.523, 0.049 |
11 | 0.446, 0.047 | 0.433, 0.046 | 0.445, 0.047 | 0.474, 0.046 |
12 | 0.460, 0.045 | 0.447, 0.049 | 0.560, 0.047 | 0.473, 0.049 |
13 | 0.503, 0.049 | 0.502, 0.045 | 0.436, 0.047 | 0.490, 0.046 |
14 | 0.367, 0.047 | 0.355, 0.047 | 0.397, 0.047 | 0.319, 0.048 |
15 | 0.472, 0.047 | 0.609, 0.045 | 0.382, 0.049 | 0.443, 0.049 |
16 | 0.447, 0.050 | 0.526, 0.050 | 0.430, 0.048 | 0.594, 0.047 |
17 | 0.561, 0.047 | 0.490, 0.049 | 0.453, 0.048 | 0.358, 0.049 |
18 | 0.569, 0.047 | 0.467, 0.048 | 0.484, 0.046 | 0.319, 0.051 |
19 | 0.671, 0.043 | 0.408, 0.049 | 0.477, 0.049 | 0.338, 0.051 |
20 | 0.471, 0.047 | 0.414, 0.049 | 0.500, 0.047 | 0.393, 0.049 |
21 | 0.513, 0.049 | 0.512, 0.049 | 0.496, 0.046 | 0.502, 0.050 |
22 | 0.470, 0.049 | 0.418, 0.048 | 0.492, 0.046 | 0.404, 0.048 |
23 | 0.474, 0.049 | 0.376, 0.048 | 0.490, 0.047 | 0.516, 0.045 |
24 | 0.355, 0.053 | 0.474, 0.047 | 0.442, 0.048 | 0.607, 0.046 |
25 | 0.446, 0.050 | 0.539, 0.050 | 0.405, 0.049 | 0.614, 0.050 |
26 | 0.482, 0.046 | 0.400, 0.049 | 0.414, 0.050 | 0.519, 0.048 |
27 | 0.472, 0.047 | 0.473, 0.048 | 0.489, 0.047 | 0.524, 0.050 |
28 | 0.464, 0.049 | 0.398, 0.049 | 0.471, 0.048 | 0.387, 0.049 |
29 | 0.558, 0.048 | 0.554, 0.047 | 0.325, 0.051 | 0.570, 0.049 |
30 | 0.421, 0.048 | 0.536, 0.049 | 0.496, 0.049 | 0.448, 0.049 |
While the overarching evaluation yields interesting results based on the brain activity of participating subjects, we additionally perform an evaluation based on the different image types. The motivation is to ensure that different media presentation mode effects could be captured separately, if required.
For the 629 measurement points for traditional images (42 per subject with outliers), we again obtain perfect classifier performance. When shifting the prediction approach to those from others, we note an overall significant reduction in TP and TN, with the corresponding overview provided in Table 3.
ˉαp/ˉθp | ˉαp/ˉβp | αcp/θcp | αcp/βcp | |
TN | 10.27, 2.87 | 9.47, 4.53 | 10.53, 2.42 | 9.87, 4.93 |
TP | 10.47, 2.67 | 10.73, 4.20 | 10.53, 3.00 | 12.20, 3.88 |
FP | 10.53, 2.67 | 10.27, 4.20 | 10.47, 3.00 | 8.80, 3.88 |
FN | 10.73, 2.87 | 11.53, 4.53 | 10.40, 2.38 | 11.07, 4.99 |
R2 | 0.49, 0.09 | 0.48, 0.12 | 0.50, 0.09 | 0.53, 0.10 |
We initially observe that the overall levels attained for the prediction are generally comparable to those stemming from the combined base data for the KNN algorithm. Closer inspection, however, reveals that our proposed variability level metric αcp/βcp results in the highest overall accuracy level on average (M = 0.53, SD = 0.09), while other metrics involving θ remain the same and the ˉαp/ˉβp even performs slightly worse.
Lastly, for the 540 measurements from spherical images (36 per subject), classifiers result again in perfect performance. The subsequent prediction results exhibit similar trends to those prior observed for TP and TN, as presented in Table 4. Specifically, we note that while overall levels remain comparable, in this scenario our proposed ˉαp/ˉβp relationship yields the best prediction performance (M = 0.54, SD = 0.08).
ˉαp/ˉθp | ˉαp/ˉβp | αcp/θcp | αcp/βcp | |
TN | 9.27, 4.04 | 9.40, 2.16 | 8.80, 2.11 | 8.67, 3.94 |
TP | 8.80, 3.41 | 10.00, 2.70 | 9.60, 3.02 | 7.60, 4.36 |
FP | 9.20, 3.41 | 8.00, 2.70 | 8.40, 3.02 | 10.40, 4.36 |
FN | 8.73, 4.04 | 8.60, 2.16 | 9.20, 2.11 | 9.33, 3.94 |
R2 | 0.50, 0.09 | 0.54, 0.08 | 0.51, 0.08 | 0.45, 0.09 |
We now review our results, providing an additional view of the high-level R2 outcomes for the evaluation in Figure 2. We note that our approach utilized a general view on three common bands of brain waves, evaluated at readily accessible positions for head-worn devices. Additionally, the KNN approach we employed throughout our contribution has the benefit of being employable in unsupervised learning scenarios, making it well suited for ad-hoc situations.
We note that on overall average, the ˉαp/ˉβp could be employed for an estimation of the cognitive high/low load levels and would yield better results than individual user approximations. (Noting the caveat of limited measurement data points for individual users in the underlying dataset.) Thus, an overall pool of measurements has the increased benefit of enabling future prediction scenarios. The prediction of high/low cognitive loads, in turn, enables an estimation of the performance of AR device users in several upcoming utilization scenarios. If, however, the type of media presented to users is known, for regular (non-immersive) media content, the ˉβp(1+σ(αp))/ˉαp(1+σ(βp)) relationship does provide an increase in the prediction performance over the alternative approaches we evaluated here.
Given the range of R2 values we observed here, we note that this initial attempt of modeling the cognitive load in AR scenarios could be improved further. For example, additional user-specific knowledge could yield further increases in accuracy of predicted cognitive level states. Furthermore, other sensor positions that would still be able to be combined with head-worn devices for actual task usage could be considered as well.
The overall real-world impact for future industrial usage of media presented to AR device users is given as follows. Consider a scenario where users are to be augmented with respect to their capabilities, e.g., to perform tasks they did not have encountered before. Examples for such tasks include maintenance and operations, with instructions directly taken from manuals. As instructions are sent to the mobile user in form of multimedia (images, illustrations, etc.), in-network content adaptation is required to enable timely content delivery to the mobile device for timely display. As content is prone to further compression, additional cognitive strain is resultant for the device wearer leading to reduced task performance. We have successfully demonstrated a fist evaluation of how the impact could be quantified and, subsequently, be acted upon. Additional research is needed, however, to quantify the impacts in real-life industrial scenarios, such as ad-hoc maintenance and operations for machinery with the help of displayed AR content (e.g., maintenance manual pages or pictorial representations).
As the utilization of AR solutions in industrial settings increases, the content optimization for delivery and its display in interplay with the impact that these have on the operator performance will increase in importance. We provided a new evaluation of the cognitive load or strain for augmented reality device operators with regular and immersive image content, finding that a KNN approach yields R2scores around 0.5 and above in most cases, but individual prediction of the cognitive load for device operators is less accurate.
In ongoing research, we are evaluating virtual reality scenarios in addition to augmented reality scenarios. Furthermore, we consider different sensor placements and other forms of content suitable for future industrial scenarios of user capability augmentation. Another interesting avenue of follow-up research is the inclusion of different task scenarios and additional comparisons of experience sampling approaches and secondary indicators for cognitive load.
This material is based upon work supported by the Faculty Research and Creative Endeavors (FRCE) program at Central Michigan University under grant #48146.
The authors declare that this is original work not under review anywhere else and that there is no conflict of interest.
[1] | Pierdicca R, Frontoni E, Pollini R, et al. (2017) The Use of Augmented Reality Glasses for the Application in Industry 4.0. In: De Paolis L, Bourdot P, Mongelli A. Editors. Augmented Reality, Virtual Reality, and Computer Graphics, Cham, Switzerland: Springer, 389-401. |
[2] |
Gabbard J, Fitch G, Kim H (2014) Behind the Glass: Driver Challenges and Opportunities for AR Automotive Applications. P IEEE 102: 124-136. doi: 10.1109/JPROC.2013.2294642
![]() |
[3] |
Rolland J, Fuchs H (2000) Optical Versus Video See-Through Head-Mounted Displays in Medical Visualization Presence. Presence-Teleop Virt 9: 287-309. doi: 10.1162/105474600566808
![]() |
[4] |
Traub J, Sielhorst T, Heining S, et al. (2008) Advanced Display and Visualization Concepts for Image Guided Surgery. J Disp Technol 4: 483-490. doi: 10.1109/JDT.2008.2006510
![]() |
[5] | Clini P, Frontoni E, Quattrini R, et al. (2014) Augmented Reality Experience: From High-resolution Acquisition to Real Time Augmented Contents. Adv Multimedia 2014: 9. |
[6] | Lee K (2012) Augmented Reality in Education and Training. Techtrends 56: 13-21. |
[7] | Backs R, Boucsein W (2000) Author, Engineering Psychophysiology: Issues and Applications. Mahwah, NJ, USA: Lawrence Erlbaum. |
[8] |
Gevins A, Smith M, McEvoy L, et al. (1997) High-resolution EEG mapping of cortical activation related to working memory: effects of task difficulty, type of processing, and practice. Cereb Cortex 7: 374-385. doi: 10.1093/cercor/7.4.374
![]() |
[9] |
Sweller J (1988) Cognitive Load During Problem Solving: Effects on Learning. Cognitive science 12: 257-285. doi: 10.1207/s15516709cog1202_4
![]() |
[10] |
Kumar N, Kumar J (2016) Measurement of Cognitive Load in HCI Systems Using EEG Power Spectrum: An Experimental Study. Procedia Computer Science 84: 70-78. doi: 10.1016/j.procs.2016.04.068
![]() |
[11] |
Gevins A, Smith M, Leong H, et al. (1998) Monitoring Working Memory Load during Computer-Based Tasks with EEG Pattern Recognition Methods. Human Factors 40: 79-91. doi: 10.1518/001872098779480578
![]() |
[12] |
Mazher M, Aziz A, Malik A, et al. (2017) An EEG-Based Cognitive Load Assessment in Multimedia Learning Using Feature Extraction and Partial Directed Coherence. IEEE Access 5: 14819-14829. doi: 10.1109/ACCESS.2017.2731784
![]() |
[13] |
Holm A, Lukander K, Korpela J, et al. (2009) Estimating Brain Load from the EEG. The Scientific World J 9: 639-651. doi: 10.1100/tsw.2009.83
![]() |
[14] | Plechawska-W´ojcik M, Wawrzyk M, Wesołowska K, et al. (2017) EEG spectral analysis of human cognitive workload study. Studia Informatica 38: 17-30. |
[15] |
Bauman B, Seeling P (2017) Visual Interface Evaluation for Wearables Datasets: Predicting the Subjective Augmented Vision Image QoE and QoS. Future Internet 9: 40. doi: 10.3390/fi9030040
![]() |
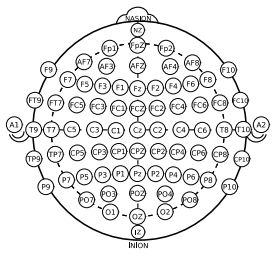
[16] | Oxkey B (2017) International 10-20 system for EEG electrode placement, showing modified combinatorial nomenclature. Available from: https://commons.wikimedia.org/wiki/File:International_10-20_system_for_ EEG-MCN.svg. |
[17] | Bonanni L Lee C-H, Selker T (2005) Attention-based Design of Augmented Reality Interfaces. Extended Abstracts on Human Factors in Computing Systems Portland, OR, USA: 1228-1231. |
[18] |
Hart SG (2006) NASA-task load index (NASA-TLX); 20 years later. Proceedings of the Human Factors and Ergonomics Society Annual Meeting 50: 904-908. doi: 10.1177/154193120605000909
![]() |
[19] | Rentzos L, Vourtsis C, Mavrikios D, Chryssolouris G (2014) Using VR for Complex Product Design. In: Shumaker R and Lackey S (eds) Virtual, Augmented and Mixed Reality. Proceedings of the 6th International Conference Applications of Virtual and Augmented Reality Crete, Greece: 455-464. |
[20] |
Nee AYC, Ong SK, Chryssolouris G, Mourtzis D (2012) Augmented reality applications in design and manufacturing. CIRP Annals 61: 657-679. doi: 10.1016/j.cirp.2012.05.010
![]() |
[21] |
Makris S, Karagiannis P, Koukas S, Matthaiakis A-S (2016) Augmented reality system for operator support in humanrobot collaborative assembly. CIRP Annals 65: 61-64. doi: 10.1016/j.cirp.2016.04.038
![]() |
[22] |
Makris S, Pintzos G, Rentzos L, Chryssolouris G (2013) Assembly support using AR technology based on automatic sequence generation. CIRP Annals 62: 9-12. doi: 10.1016/j.cirp.2013.03.095
![]() |
1. | Brian Bauman, Patrick Seeling, 2018, Evaluation of EEG-Based Predictions of Image QoE in Augmented Reality Scenarios, 978-1-5386-6358-5, 1, 10.1109/VTCFall.2018.8690566 | |
2. | Foteini Gramouseni, Georgios Prapas, Pantelis Angelidis, Nikolaos Giannakeas, Markos G. Tsipouras, 2023, Augmenting Education, 979-8-3503-2845-5, 1, 10.1109/iMETA59369.2023.10294647 | |
3. | Yuko Suzuki, Fridolin Wild, Eileen Scanlon, Measuring cognitive load in augmented reality with physiological methods: A systematic review, 2023, 0266-4909, 10.1111/jcal.12882 | |
4. | Foteini Gramouseni, Katerina D. Tzimourta, Pantelis Angelidis, Nikolaos Giannakeas, Markos G. Tsipouras, Cognitive Assessment Based on Electroencephalography Analysis in Virtual and Augmented Reality Environments, Using Head Mounted Displays: A Systematic Review, 2023, 7, 2504-2289, 163, 10.3390/bdcc7040163 |
ˉαp/ˉθp | ˉαp/ˉβp | αcp/θcp | αcp/βcp | |
TN | 9.67, 3.48 | 9.50, 3.46 | 9.60, 2.44 | 9.30, 4.42 |
TP | 9.63, 3.11 | 10.30, 3.41 | 10.07, 2.95 | 9.83, 4.67 |
FP | 9.87, 3.07 | 9.20, 3.55 | 9.43, 3.09 | 9.67, 4.10 |
FN | 9.83, 3.54 | 10.00, 3.80 | 9.87, 2.30 | 10.17, 4.51 |
R2 | 0.49, 0.09 | 0.51, 0.10 | 0.50, 0.09 | 0.49, 0.10 |
Subject | ˉαp/ˉθp | ˉαp/ˉβp | αcp/θcp | αcp/βcp |
1 | 0.343, 0.047 | 0.419, 0.050 | 0.351, 0.047 | 0.429, 0.050 |
2 | 0.488, 0.048 | 0.471, 0.050 | 0.419, 0.049 | 0.454, 0.048 |
3 | 0.450, 0.046 | 0.476, 0.047 | 0.484, 0.045 | 0.513, 0.048 |
4 | 0.547, 0.047 | 0.412, 0.050 | 0.654, 0.044 | 0.481, 0.050 |
5 | 0.454, 0.047 | 0.410, 0.049 | 0.424, 0.050 | 0.452, 0.048 |
6 | 0.544, 0.050 | 0.410, 0.047 | 0.480, 0.049 | 0.543, 0.049 |
7 | 0.451, 0.048 | 0.431, 0.049 | 0.532, 0.048 | 0.478, 0.047 |
8 | 0.360, 0.050 | 0.473, 0.047 | 0.475, 0.049 | 0.570, 0.047 |
9 | 0.451, 0.049 | 0.482, 0.048 | 0.571, 0.046 | 0.458, 0.049 |
10 | 0.437, 0.049 | 0.449, 0.048 | 0.530, 0.045 | 0.523, 0.049 |
11 | 0.446, 0.047 | 0.433, 0.046 | 0.445, 0.047 | 0.474, 0.046 |
12 | 0.460, 0.045 | 0.447, 0.049 | 0.560, 0.047 | 0.473, 0.049 |
13 | 0.503, 0.049 | 0.502, 0.045 | 0.436, 0.047 | 0.490, 0.046 |
14 | 0.367, 0.047 | 0.355, 0.047 | 0.397, 0.047 | 0.319, 0.048 |
15 | 0.472, 0.047 | 0.609, 0.045 | 0.382, 0.049 | 0.443, 0.049 |
16 | 0.447, 0.050 | 0.526, 0.050 | 0.430, 0.048 | 0.594, 0.047 |
17 | 0.561, 0.047 | 0.490, 0.049 | 0.453, 0.048 | 0.358, 0.049 |
18 | 0.569, 0.047 | 0.467, 0.048 | 0.484, 0.046 | 0.319, 0.051 |
19 | 0.671, 0.043 | 0.408, 0.049 | 0.477, 0.049 | 0.338, 0.051 |
20 | 0.471, 0.047 | 0.414, 0.049 | 0.500, 0.047 | 0.393, 0.049 |
21 | 0.513, 0.049 | 0.512, 0.049 | 0.496, 0.046 | 0.502, 0.050 |
22 | 0.470, 0.049 | 0.418, 0.048 | 0.492, 0.046 | 0.404, 0.048 |
23 | 0.474, 0.049 | 0.376, 0.048 | 0.490, 0.047 | 0.516, 0.045 |
24 | 0.355, 0.053 | 0.474, 0.047 | 0.442, 0.048 | 0.607, 0.046 |
25 | 0.446, 0.050 | 0.539, 0.050 | 0.405, 0.049 | 0.614, 0.050 |
26 | 0.482, 0.046 | 0.400, 0.049 | 0.414, 0.050 | 0.519, 0.048 |
27 | 0.472, 0.047 | 0.473, 0.048 | 0.489, 0.047 | 0.524, 0.050 |
28 | 0.464, 0.049 | 0.398, 0.049 | 0.471, 0.048 | 0.387, 0.049 |
29 | 0.558, 0.048 | 0.554, 0.047 | 0.325, 0.051 | 0.570, 0.049 |
30 | 0.421, 0.048 | 0.536, 0.049 | 0.496, 0.049 | 0.448, 0.049 |
ˉαp/ˉθp | ˉαp/ˉβp | αcp/θcp | αcp/βcp | |
TN | 10.27, 2.87 | 9.47, 4.53 | 10.53, 2.42 | 9.87, 4.93 |
TP | 10.47, 2.67 | 10.73, 4.20 | 10.53, 3.00 | 12.20, 3.88 |
FP | 10.53, 2.67 | 10.27, 4.20 | 10.47, 3.00 | 8.80, 3.88 |
FN | 10.73, 2.87 | 11.53, 4.53 | 10.40, 2.38 | 11.07, 4.99 |
R2 | 0.49, 0.09 | 0.48, 0.12 | 0.50, 0.09 | 0.53, 0.10 |
ˉαp/ˉθp | ˉαp/ˉβp | αcp/θcp | αcp/βcp | |
TN | 9.27, 4.04 | 9.40, 2.16 | 8.80, 2.11 | 8.67, 3.94 |
TP | 8.80, 3.41 | 10.00, 2.70 | 9.60, 3.02 | 7.60, 4.36 |
FP | 9.20, 3.41 | 8.00, 2.70 | 8.40, 3.02 | 10.40, 4.36 |
FN | 8.73, 4.04 | 8.60, 2.16 | 9.20, 2.11 | 9.33, 3.94 |
R2 | 0.50, 0.09 | 0.54, 0.08 | 0.51, 0.08 | 0.45, 0.09 |
ˉαp/ˉθp | ˉαp/ˉβp | αcp/θcp | αcp/βcp | |
TN | 9.67, 3.48 | 9.50, 3.46 | 9.60, 2.44 | 9.30, 4.42 |
TP | 9.63, 3.11 | 10.30, 3.41 | 10.07, 2.95 | 9.83, 4.67 |
FP | 9.87, 3.07 | 9.20, 3.55 | 9.43, 3.09 | 9.67, 4.10 |
FN | 9.83, 3.54 | 10.00, 3.80 | 9.87, 2.30 | 10.17, 4.51 |
R2 | 0.49, 0.09 | 0.51, 0.10 | 0.50, 0.09 | 0.49, 0.10 |
Subject | ˉαp/ˉθp | ˉαp/ˉβp | αcp/θcp | αcp/βcp |
1 | 0.343, 0.047 | 0.419, 0.050 | 0.351, 0.047 | 0.429, 0.050 |
2 | 0.488, 0.048 | 0.471, 0.050 | 0.419, 0.049 | 0.454, 0.048 |
3 | 0.450, 0.046 | 0.476, 0.047 | 0.484, 0.045 | 0.513, 0.048 |
4 | 0.547, 0.047 | 0.412, 0.050 | 0.654, 0.044 | 0.481, 0.050 |
5 | 0.454, 0.047 | 0.410, 0.049 | 0.424, 0.050 | 0.452, 0.048 |
6 | 0.544, 0.050 | 0.410, 0.047 | 0.480, 0.049 | 0.543, 0.049 |
7 | 0.451, 0.048 | 0.431, 0.049 | 0.532, 0.048 | 0.478, 0.047 |
8 | 0.360, 0.050 | 0.473, 0.047 | 0.475, 0.049 | 0.570, 0.047 |
9 | 0.451, 0.049 | 0.482, 0.048 | 0.571, 0.046 | 0.458, 0.049 |
10 | 0.437, 0.049 | 0.449, 0.048 | 0.530, 0.045 | 0.523, 0.049 |
11 | 0.446, 0.047 | 0.433, 0.046 | 0.445, 0.047 | 0.474, 0.046 |
12 | 0.460, 0.045 | 0.447, 0.049 | 0.560, 0.047 | 0.473, 0.049 |
13 | 0.503, 0.049 | 0.502, 0.045 | 0.436, 0.047 | 0.490, 0.046 |
14 | 0.367, 0.047 | 0.355, 0.047 | 0.397, 0.047 | 0.319, 0.048 |
15 | 0.472, 0.047 | 0.609, 0.045 | 0.382, 0.049 | 0.443, 0.049 |
16 | 0.447, 0.050 | 0.526, 0.050 | 0.430, 0.048 | 0.594, 0.047 |
17 | 0.561, 0.047 | 0.490, 0.049 | 0.453, 0.048 | 0.358, 0.049 |
18 | 0.569, 0.047 | 0.467, 0.048 | 0.484, 0.046 | 0.319, 0.051 |
19 | 0.671, 0.043 | 0.408, 0.049 | 0.477, 0.049 | 0.338, 0.051 |
20 | 0.471, 0.047 | 0.414, 0.049 | 0.500, 0.047 | 0.393, 0.049 |
21 | 0.513, 0.049 | 0.512, 0.049 | 0.496, 0.046 | 0.502, 0.050 |
22 | 0.470, 0.049 | 0.418, 0.048 | 0.492, 0.046 | 0.404, 0.048 |
23 | 0.474, 0.049 | 0.376, 0.048 | 0.490, 0.047 | 0.516, 0.045 |
24 | 0.355, 0.053 | 0.474, 0.047 | 0.442, 0.048 | 0.607, 0.046 |
25 | 0.446, 0.050 | 0.539, 0.050 | 0.405, 0.049 | 0.614, 0.050 |
26 | 0.482, 0.046 | 0.400, 0.049 | 0.414, 0.050 | 0.519, 0.048 |
27 | 0.472, 0.047 | 0.473, 0.048 | 0.489, 0.047 | 0.524, 0.050 |
28 | 0.464, 0.049 | 0.398, 0.049 | 0.471, 0.048 | 0.387, 0.049 |
29 | 0.558, 0.048 | 0.554, 0.047 | 0.325, 0.051 | 0.570, 0.049 |
30 | 0.421, 0.048 | 0.536, 0.049 | 0.496, 0.049 | 0.448, 0.049 |
ˉαp/ˉθp | ˉαp/ˉβp | αcp/θcp | αcp/βcp | |
TN | 10.27, 2.87 | 9.47, 4.53 | 10.53, 2.42 | 9.87, 4.93 |
TP | 10.47, 2.67 | 10.73, 4.20 | 10.53, 3.00 | 12.20, 3.88 |
FP | 10.53, 2.67 | 10.27, 4.20 | 10.47, 3.00 | 8.80, 3.88 |
FN | 10.73, 2.87 | 11.53, 4.53 | 10.40, 2.38 | 11.07, 4.99 |
R2 | 0.49, 0.09 | 0.48, 0.12 | 0.50, 0.09 | 0.53, 0.10 |
ˉαp/ˉθp | ˉαp/ˉβp | αcp/θcp | αcp/βcp | |
TN | 9.27, 4.04 | 9.40, 2.16 | 8.80, 2.11 | 8.67, 3.94 |
TP | 8.80, 3.41 | 10.00, 2.70 | 9.60, 3.02 | 7.60, 4.36 |
FP | 9.20, 3.41 | 8.00, 2.70 | 8.40, 3.02 | 10.40, 4.36 |
FN | 8.73, 4.04 | 8.60, 2.16 | 9.20, 2.11 | 9.33, 3.94 |
R2 | 0.50, 0.09 | 0.54, 0.08 | 0.51, 0.08 | 0.45, 0.09 |